Analyze individual protein chains or complex multi-chain interfaces. Computes hydrogen bonds, salt bridges, hydrophobic contacts, disulfide connectivity, amino acid composition, secondary structure wiring, and Ramachandran plots without needing Biopython or external servers.
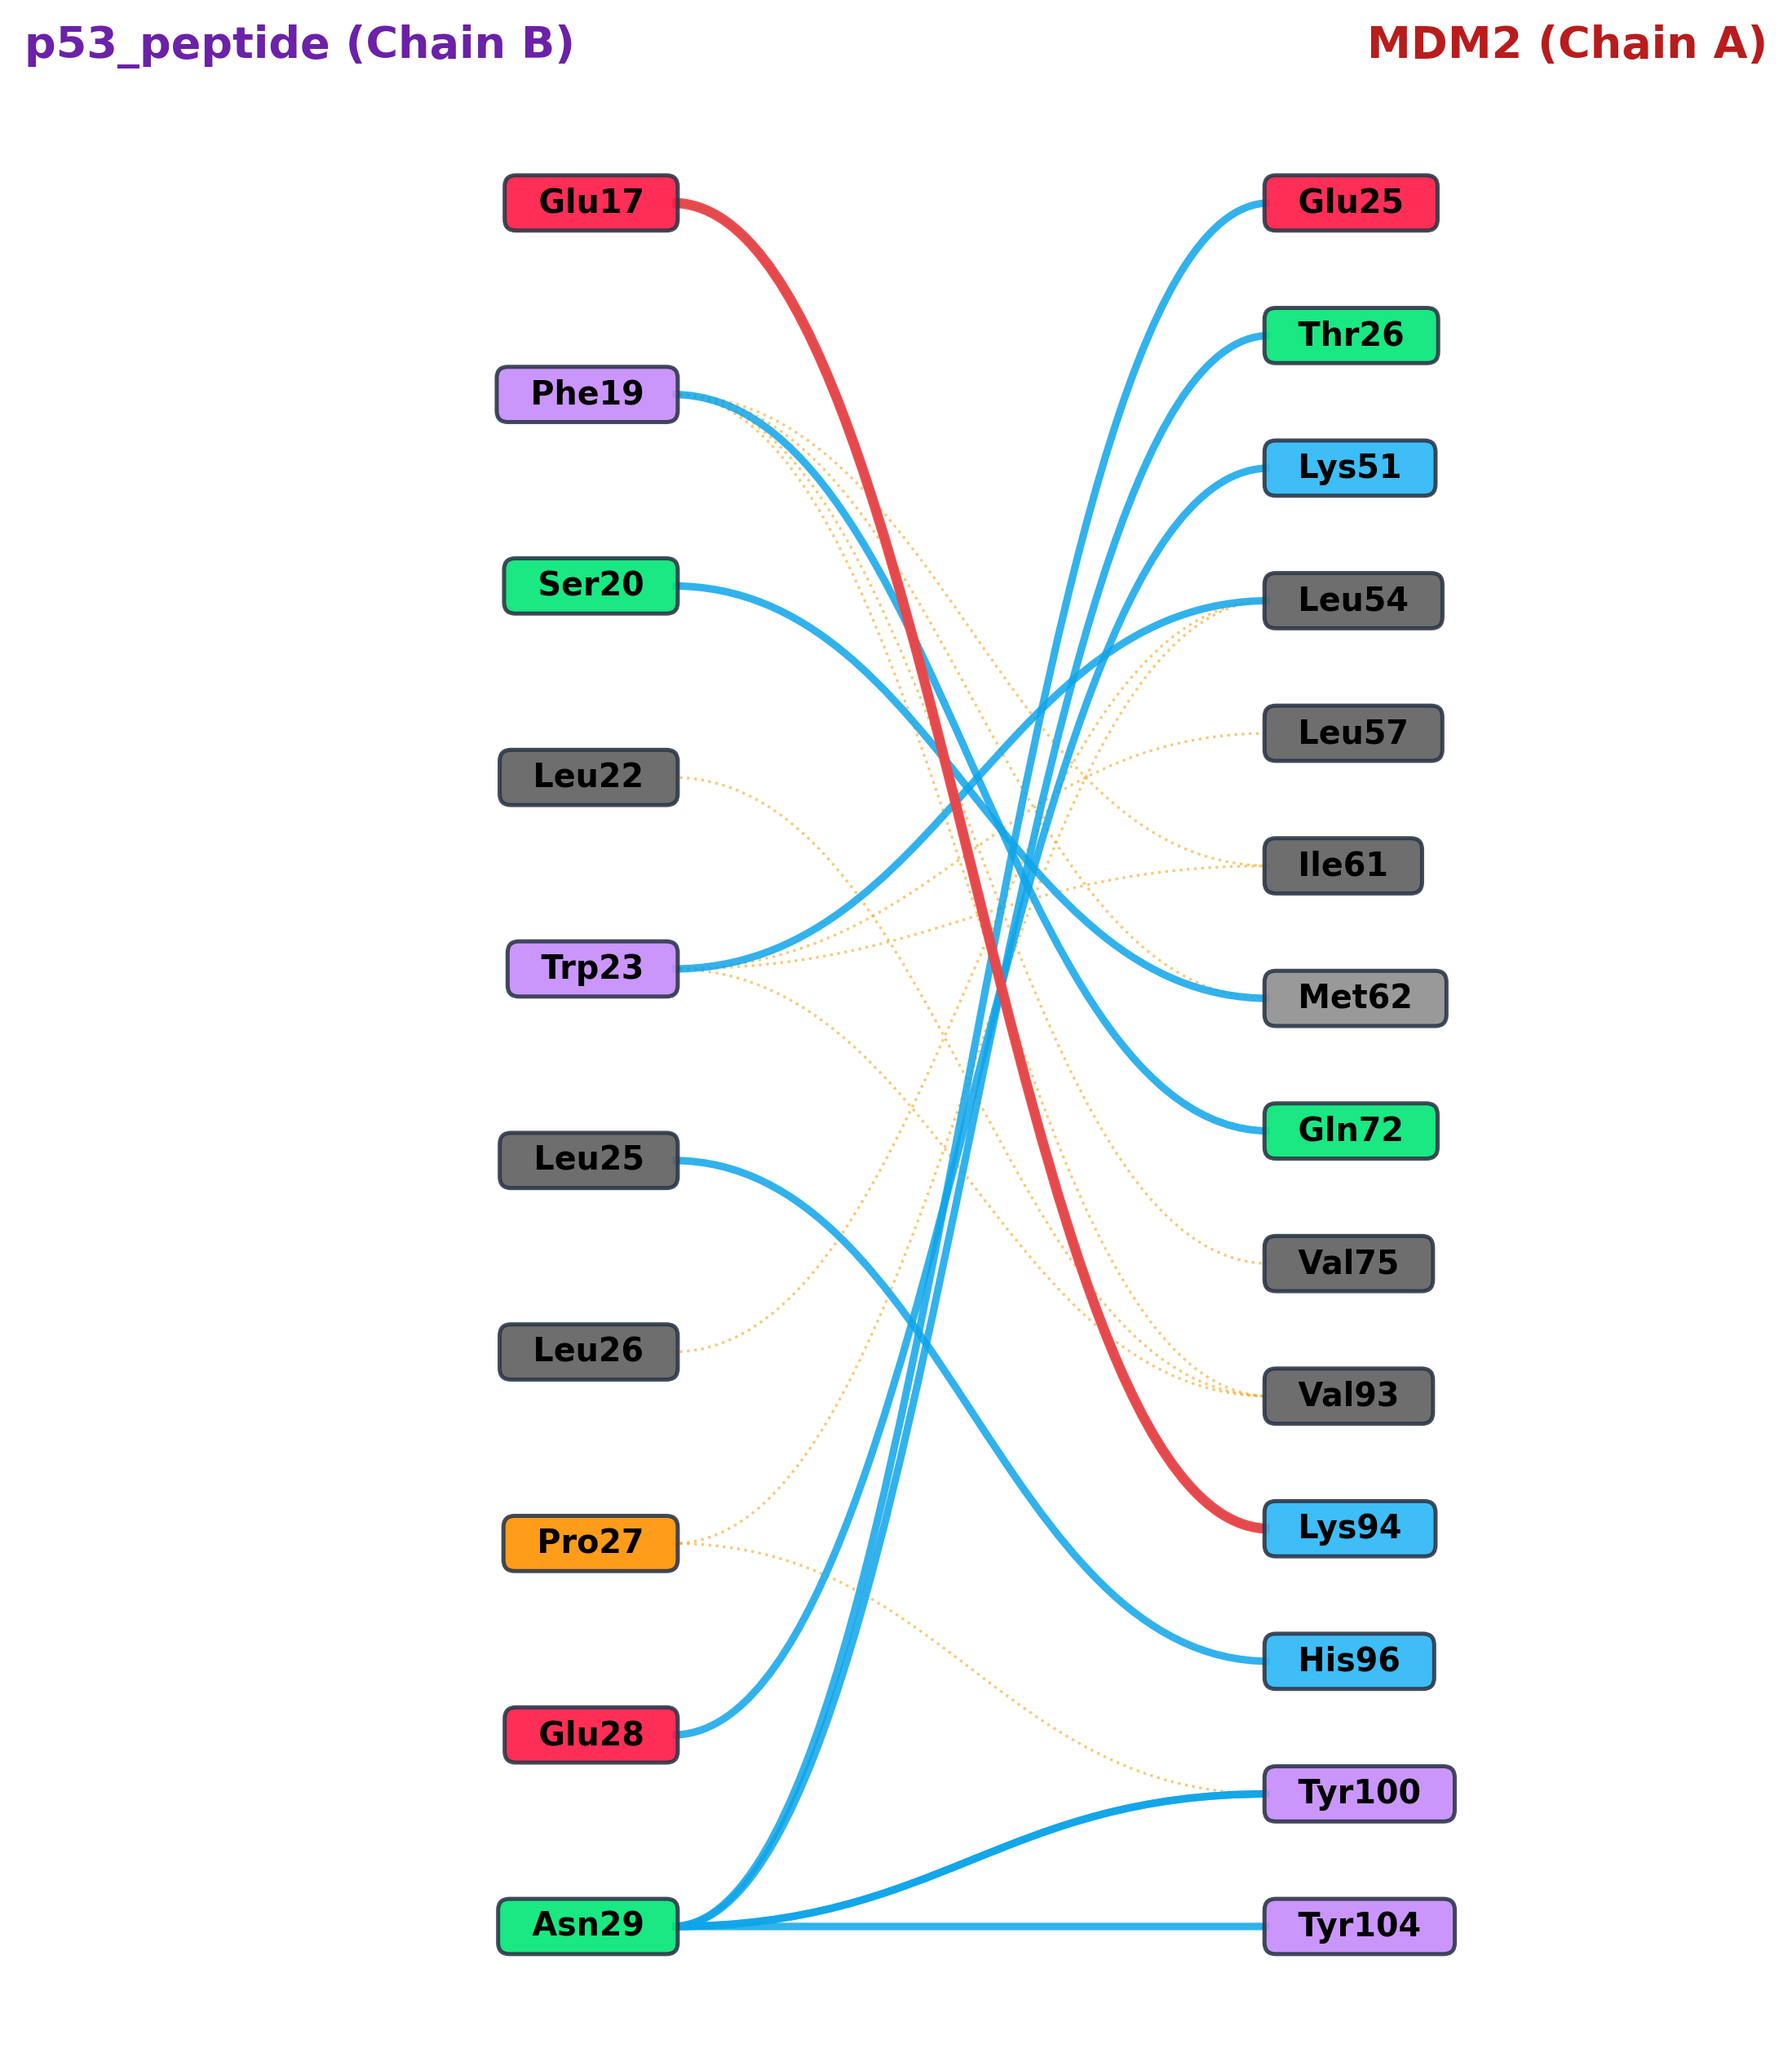
ATOM 723 N PHE B 19 32.143 -27.542 -11.625 1.00 22.45 N ATOM 727 CB PHE B 19 32.674 -25.245 -10.916 1.00 12.04 Chydrophobic · Met62 ATOM 756 CA TRP B 23 27.021 -24.553 -7.803 1.00 20.10 C ATOM 764 NE1 TRP B 23 26.659 -20.002 -7.892 1.00 8.62 Nh-bond · 2.83Å · Leu54 ATOM 811 N ASN B 29 16.925 -19.172 -2.791 1.00 37.74 N ATOM 711 OE1 GLU B 17 32.302 -32.543 -7.098 1.00 60.54 Osalt bridge · 3.40Å · Lys94
Every calculation uses exact geometric criteria extracted directly from the atomic coordinates in your PDB file.
Polar atom pairs (N/O/S) positioned close enough to plausibly hydrogen-bond.
2.4–3.5 ÅOppositely charged side-chain atoms (Asp/Glu against Lys/Arg/His) within range.
≤ 4.0 ÅNon-polar carbon atoms from hydrophobic residues packed against each other.
≤ 4.0 Å
When evaluating a single protein chain in isolation, run pdbsum_single_chain_analyzer.py.
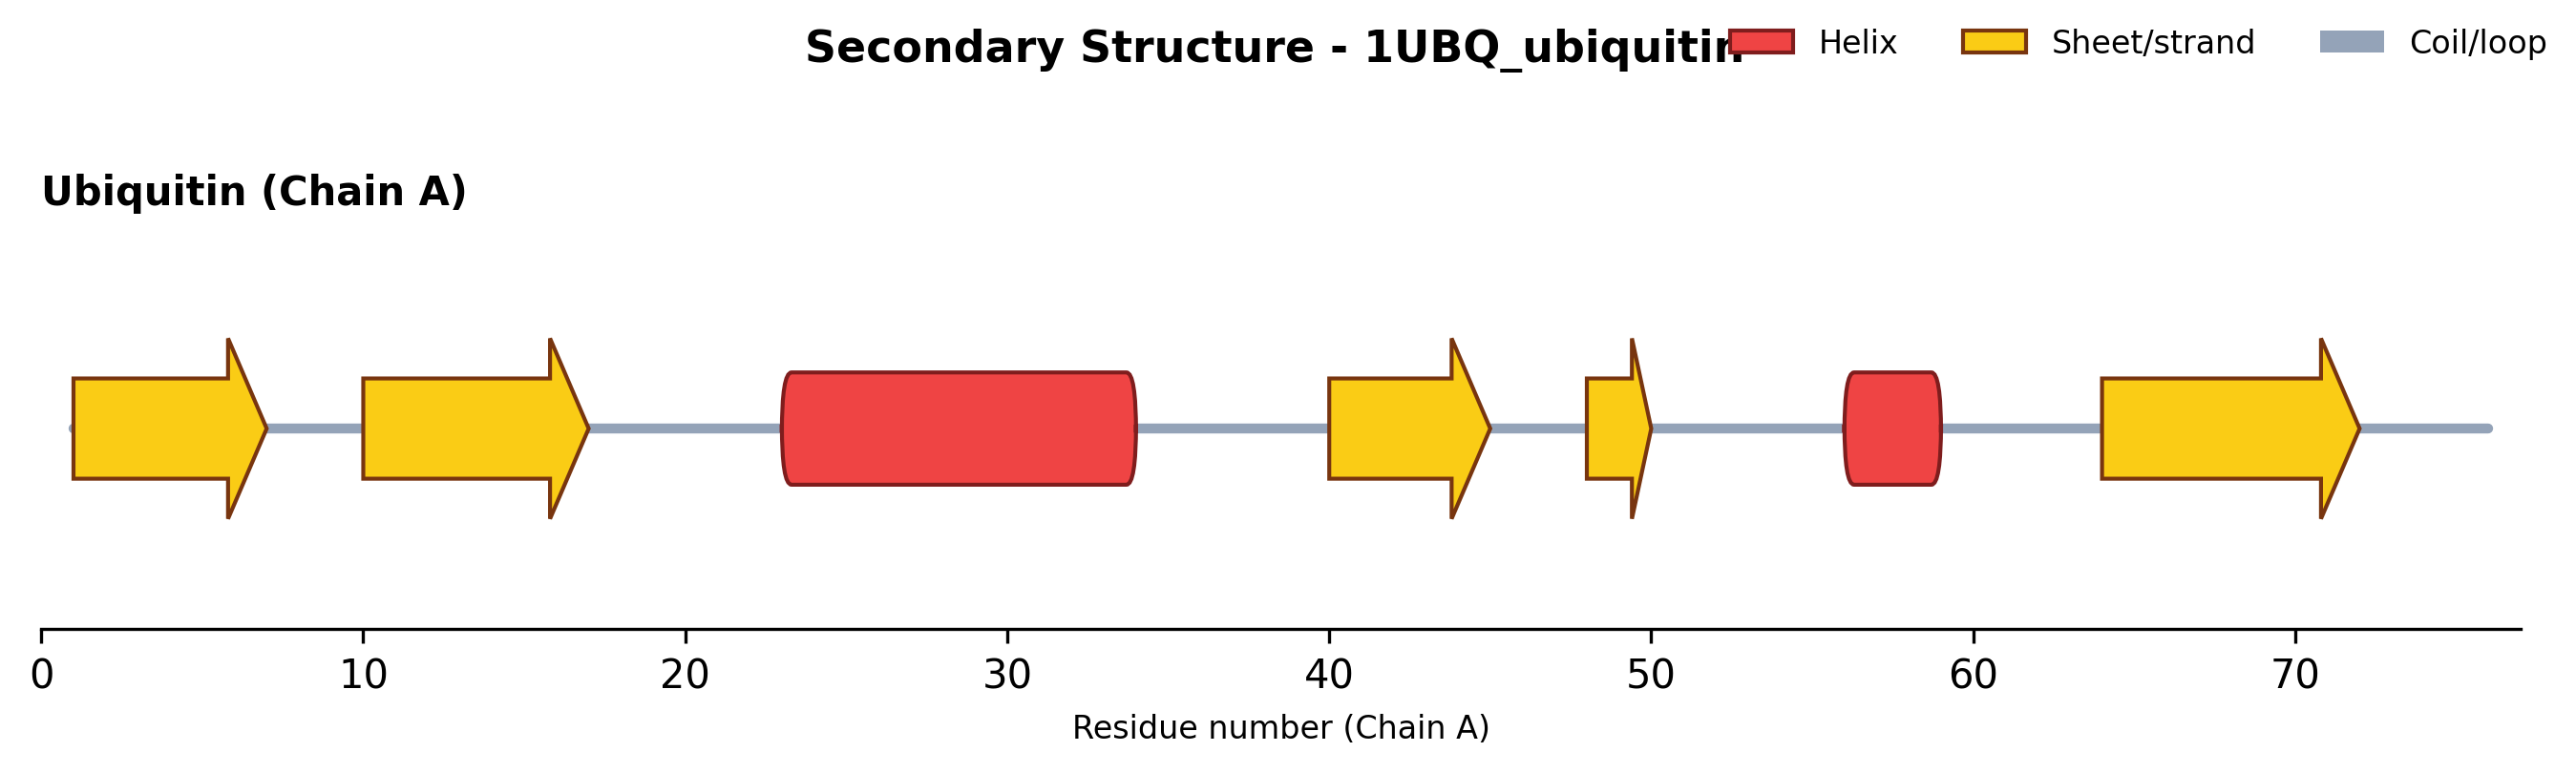
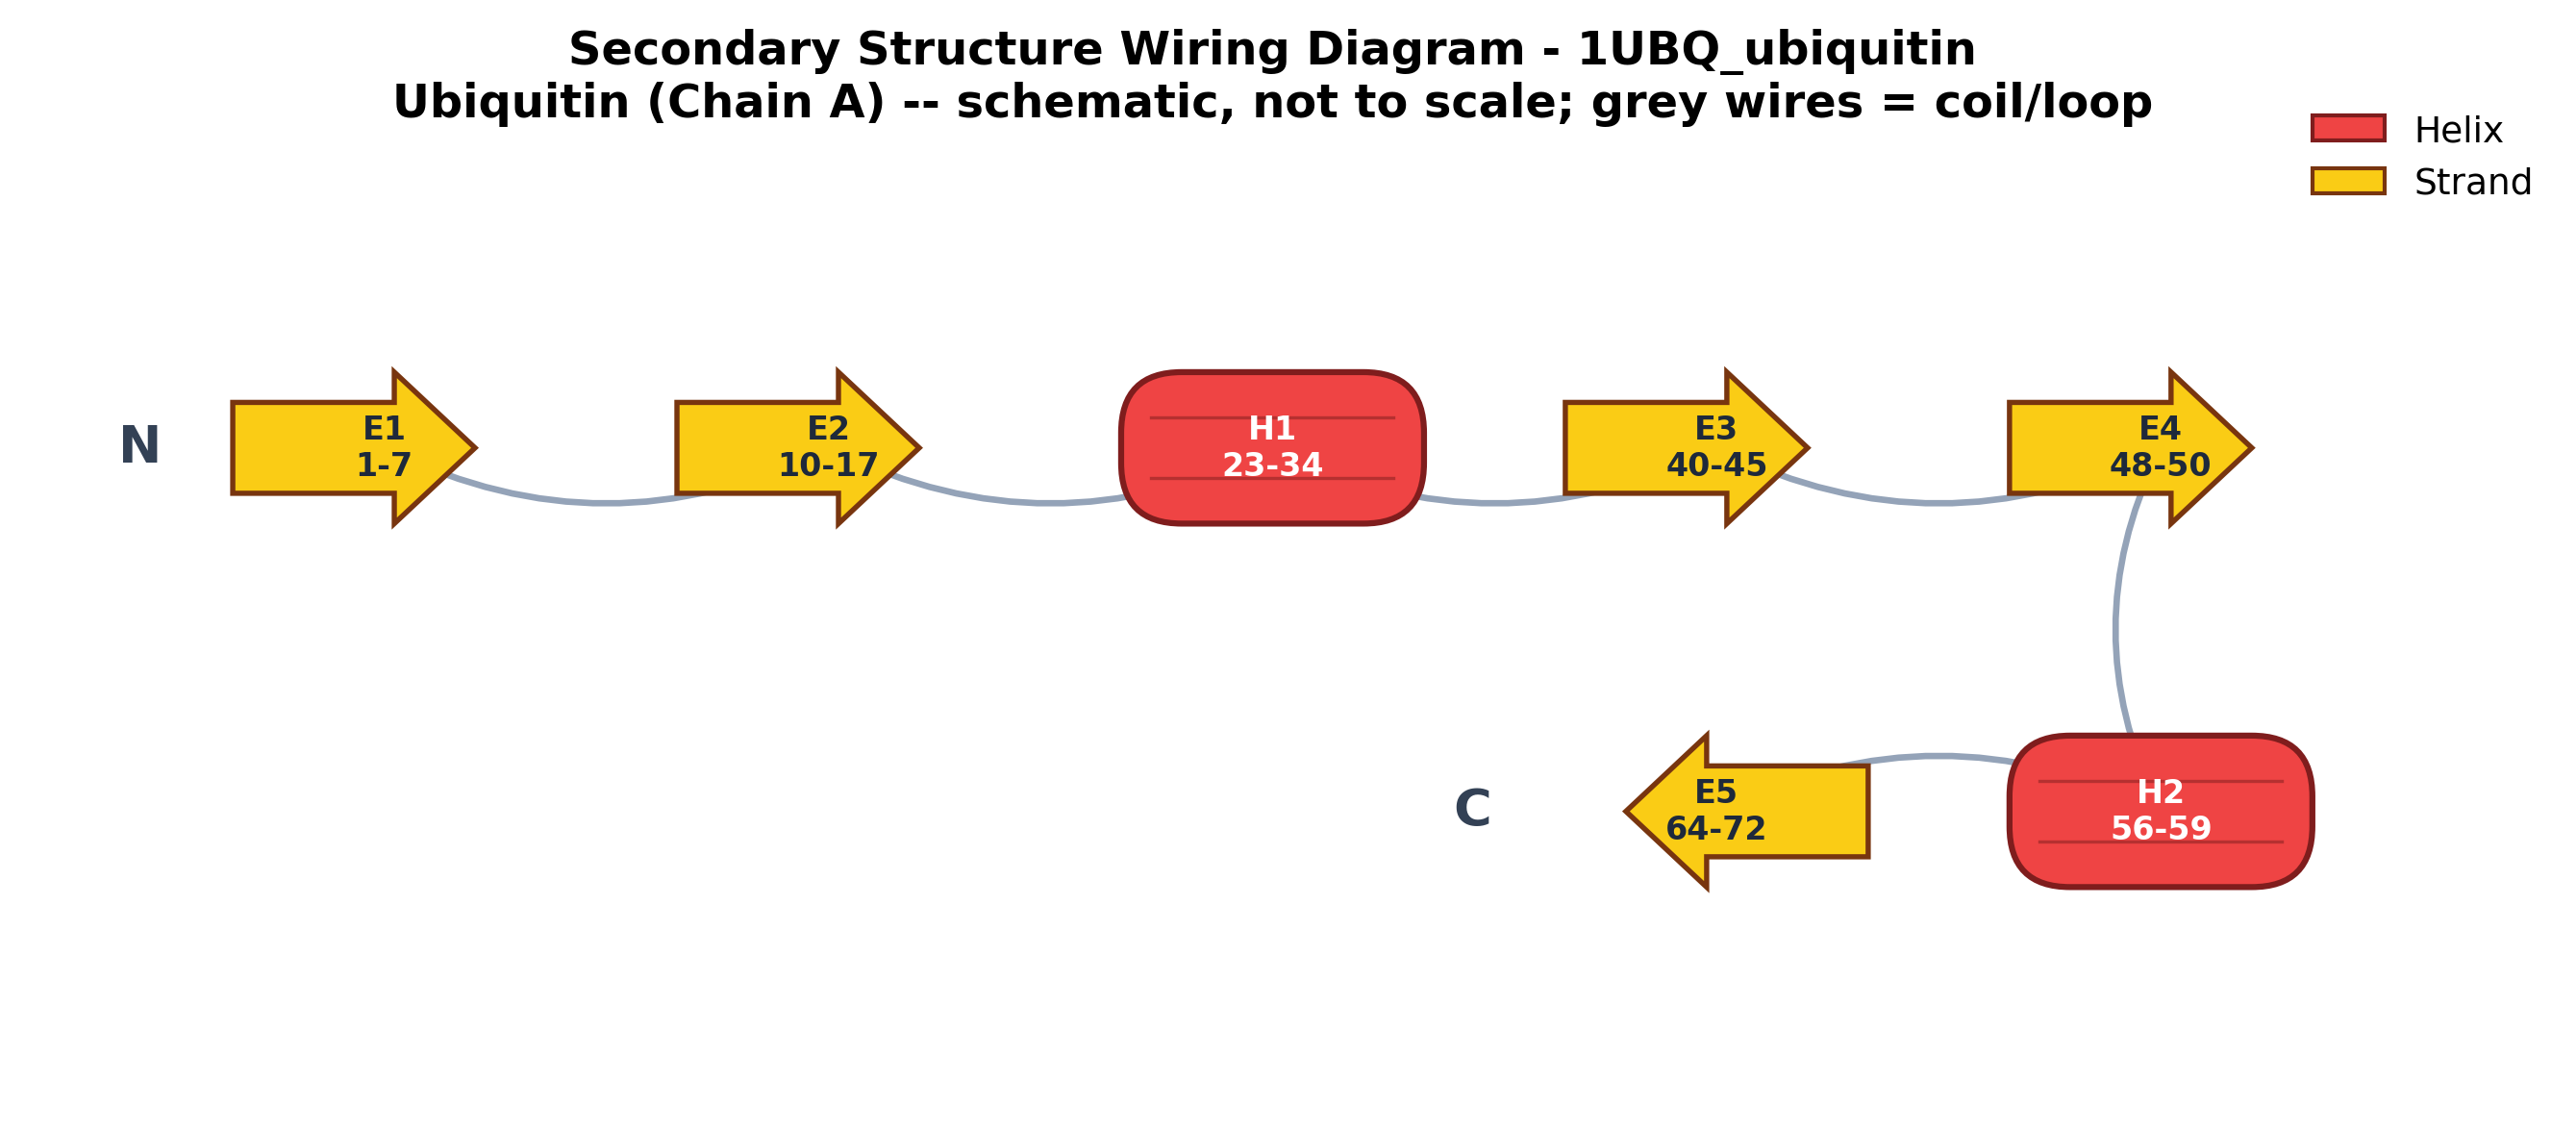
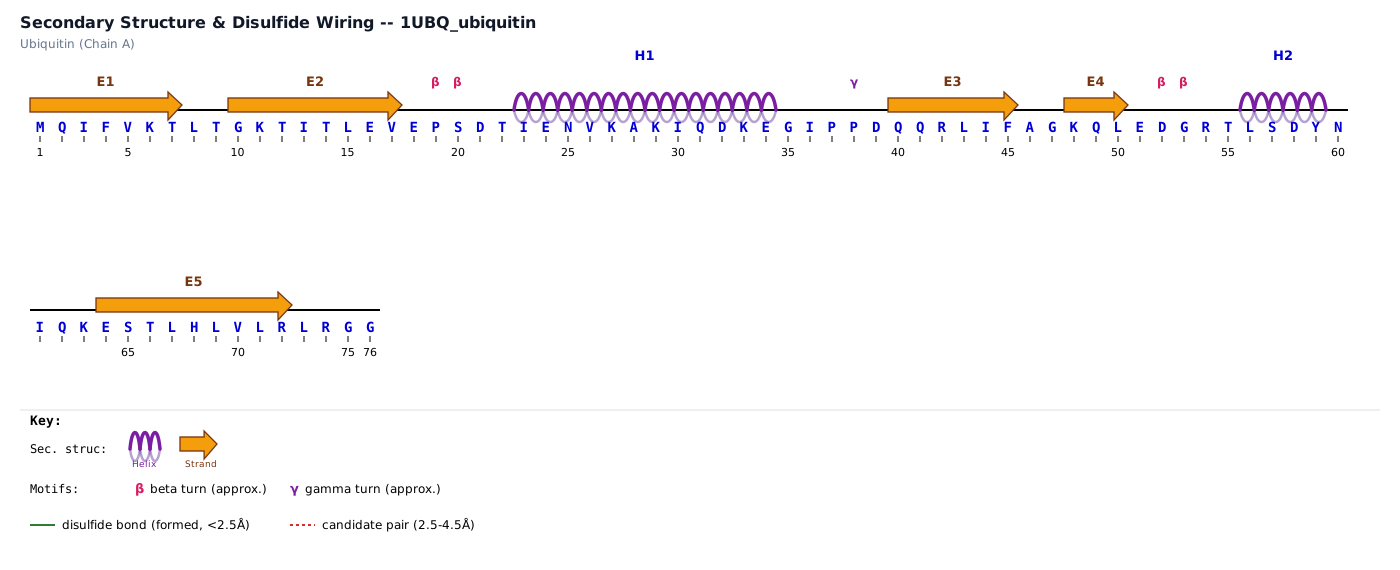
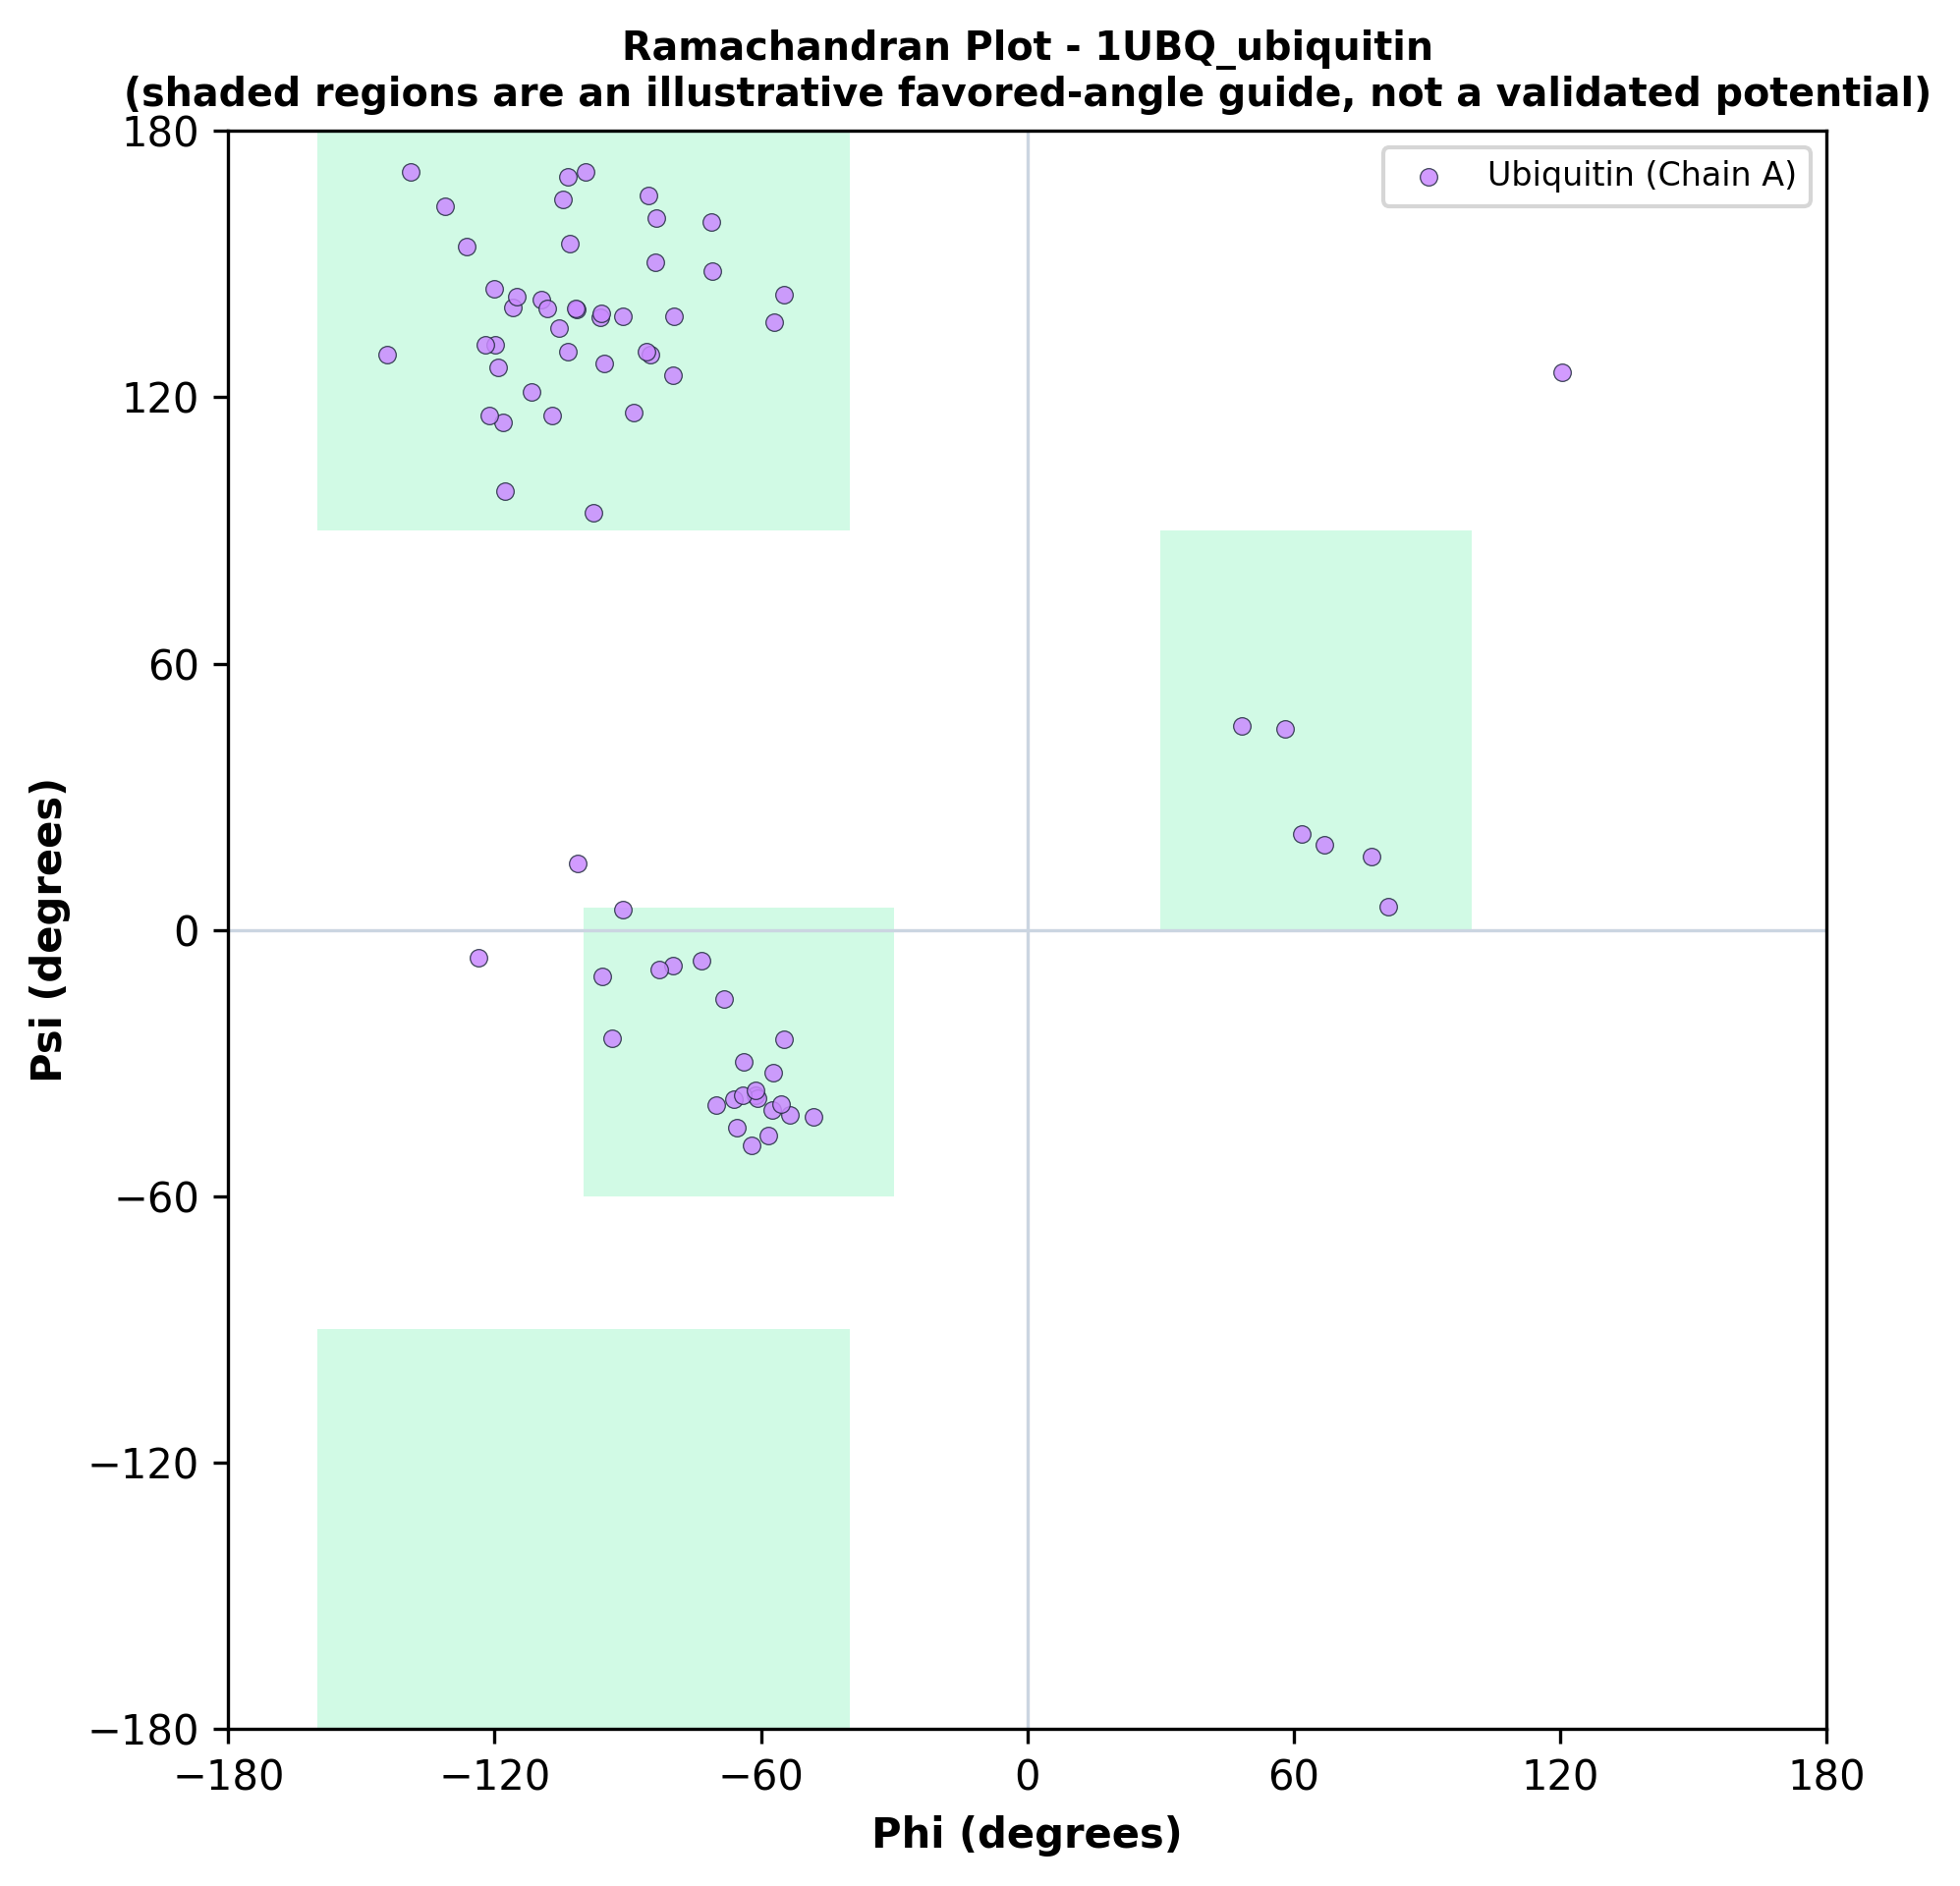
Shown below are the 5 core diagnostic figures generated for Ubiquitin (1UBQ), detailing sequence composition, secondary structure topology, disulfide connectivity, and backbone dihedrals.
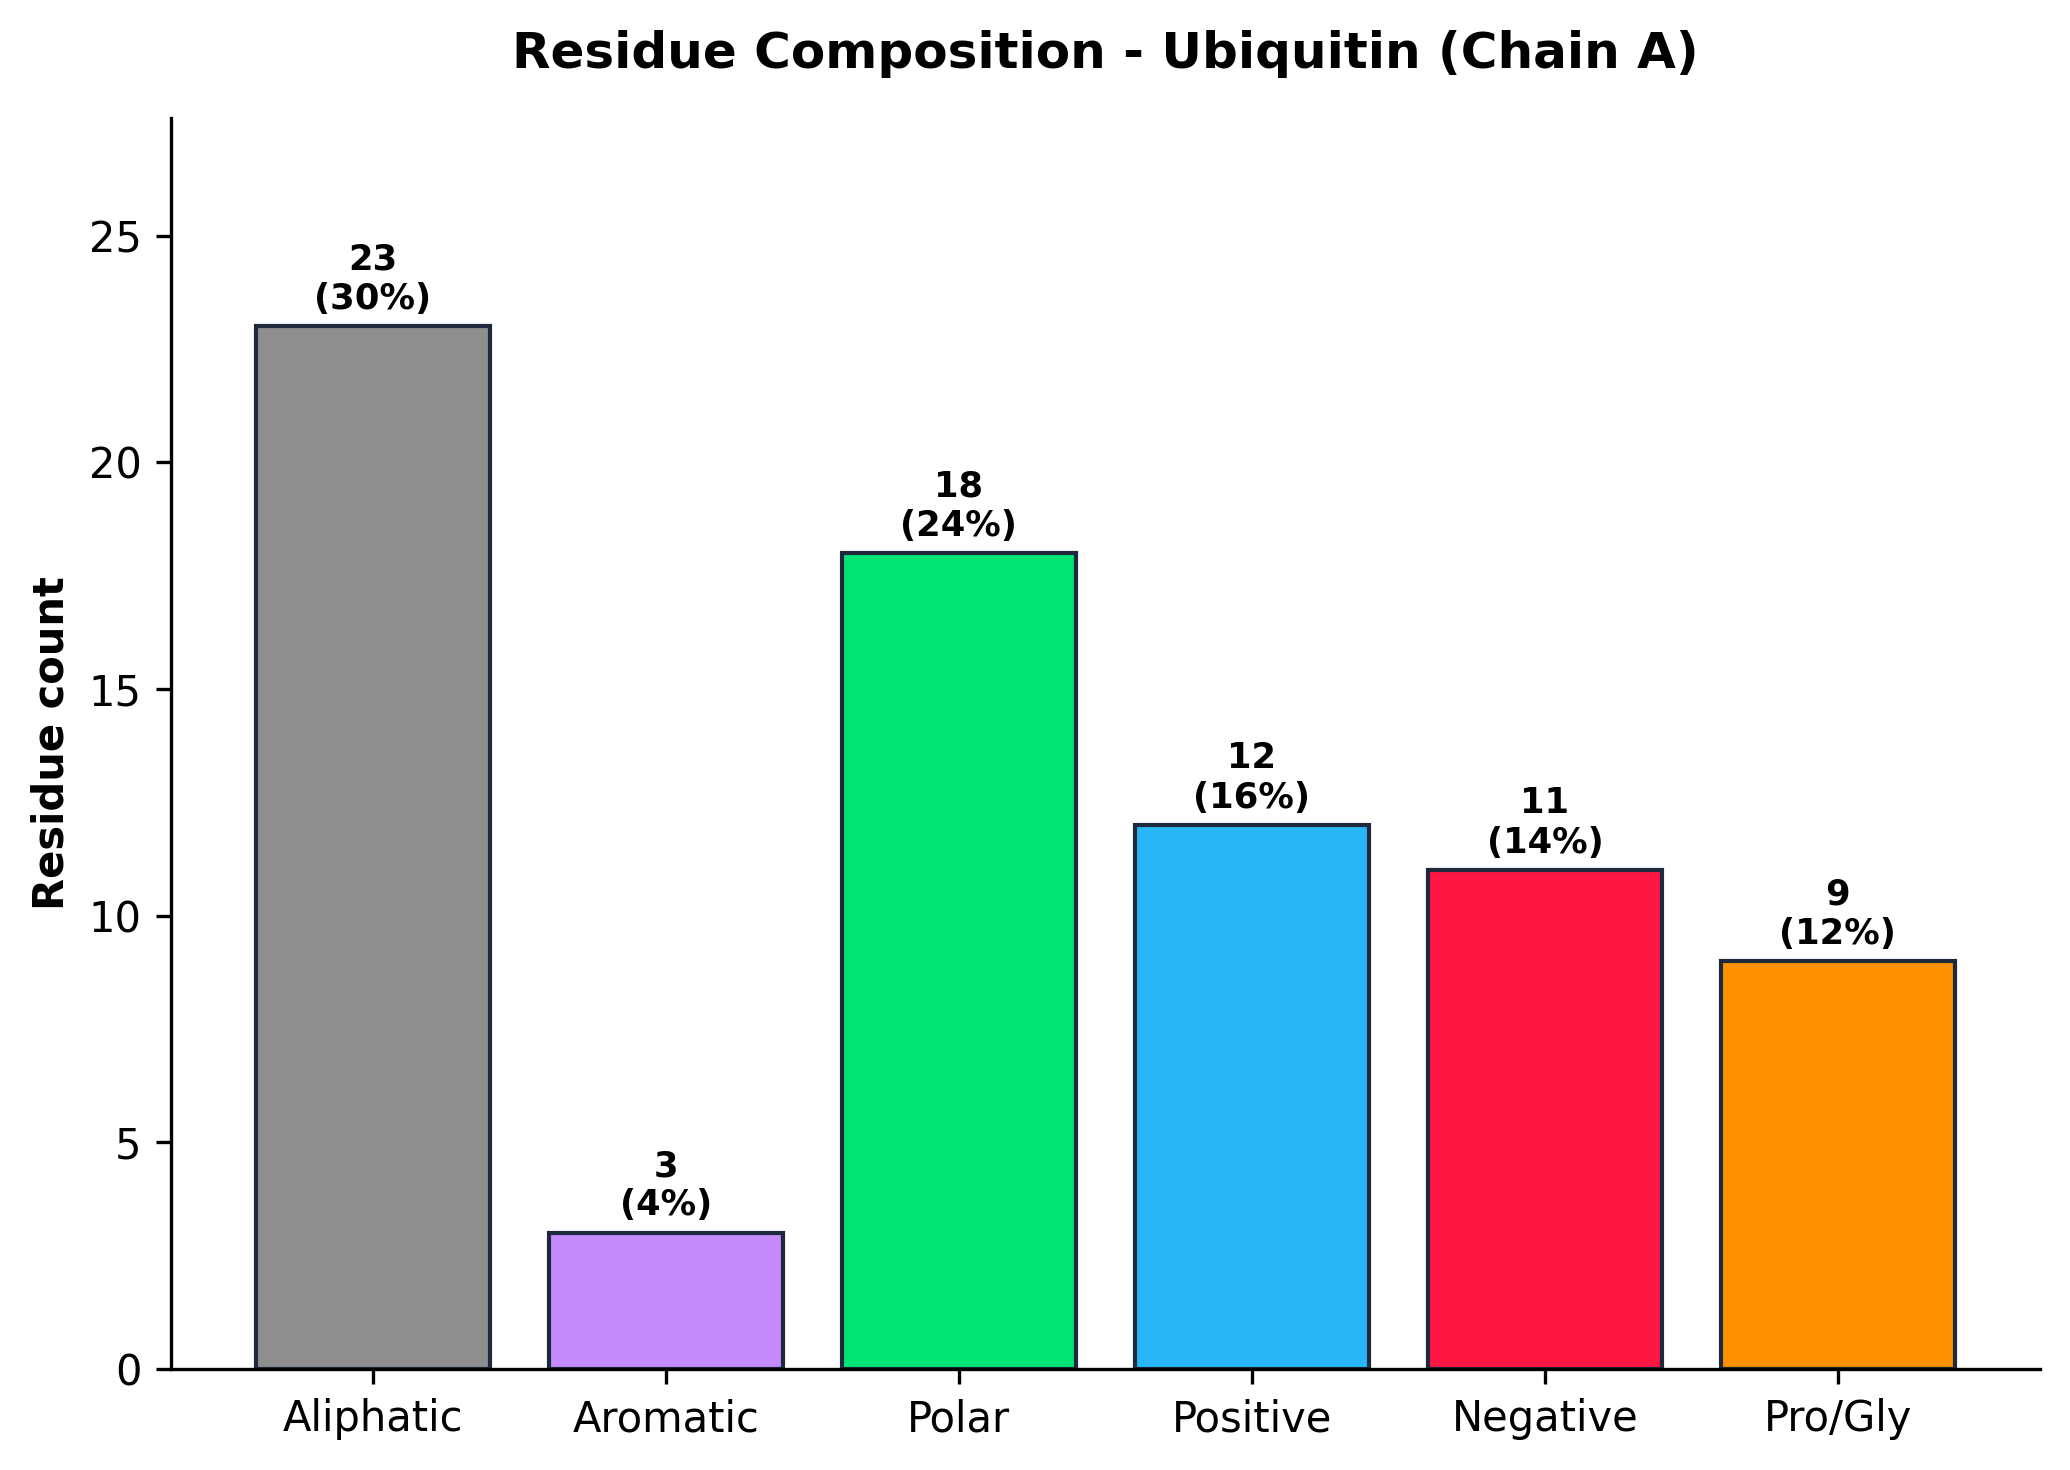
Command: python src/pdbsum_single_chain_analyzer.py examples/data/1UBQ_ubiquitin.pdb --chain A. Includes a detailed Chain_Structure_Report.txt report.
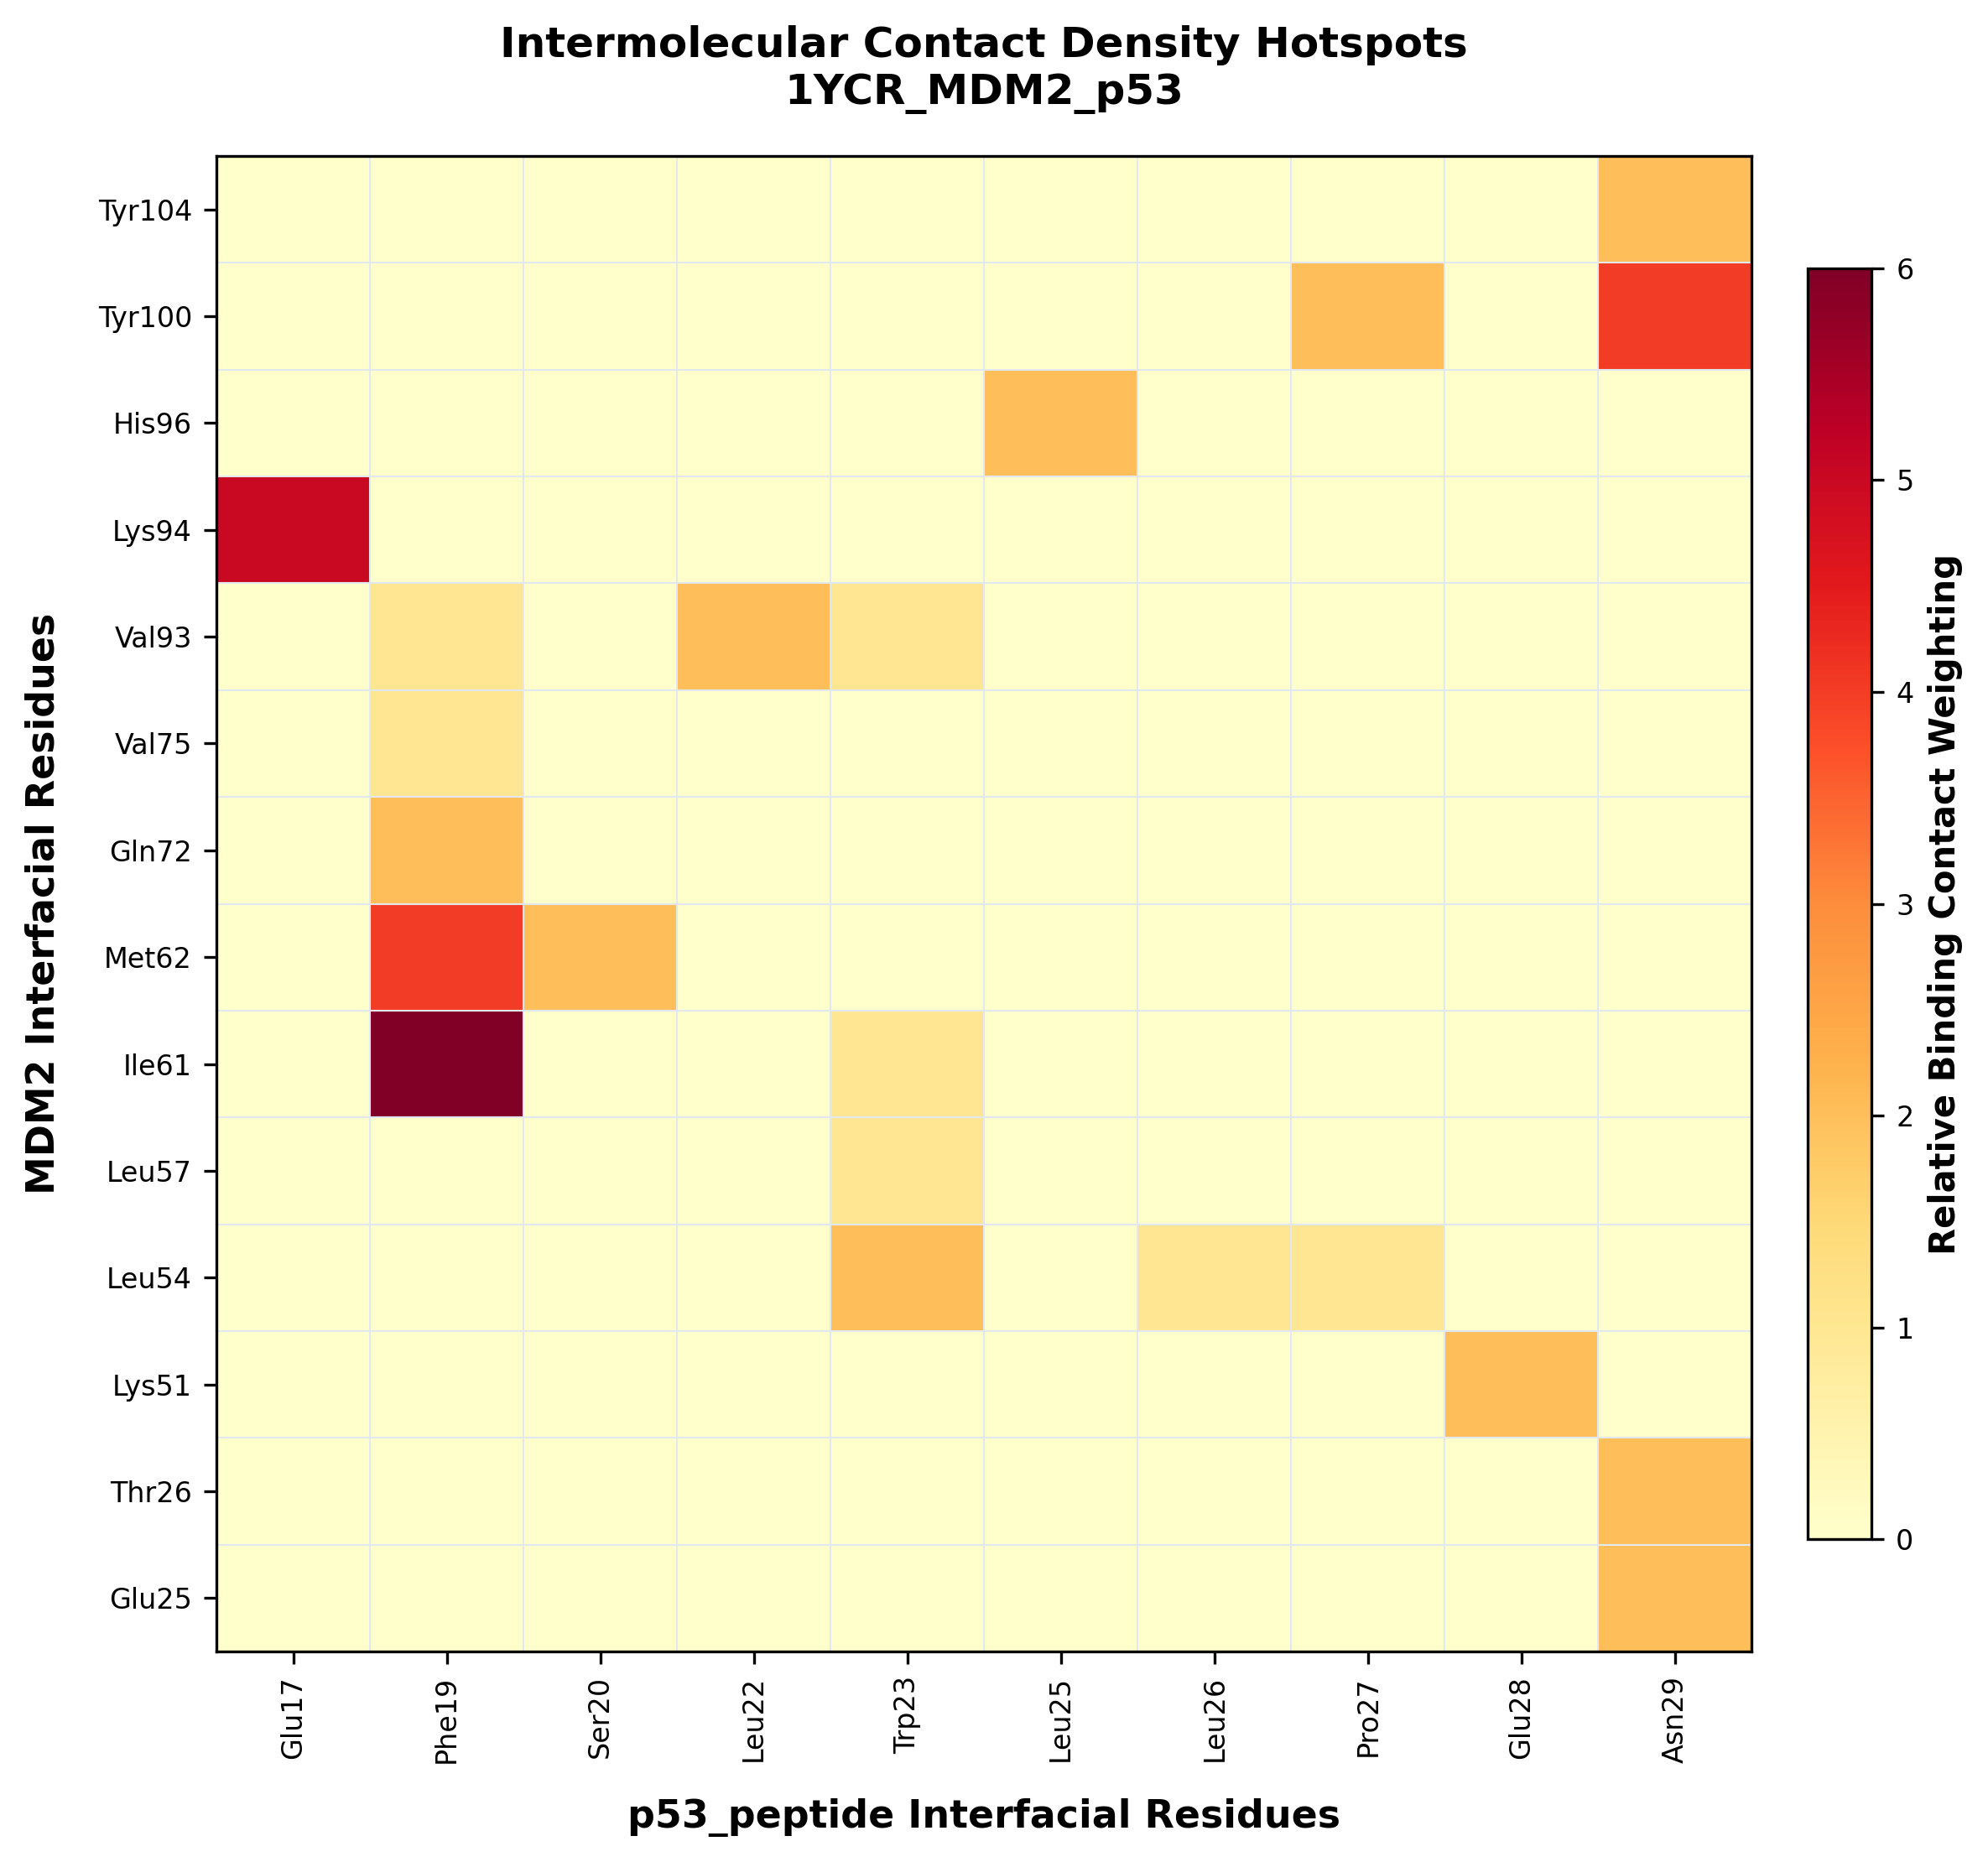
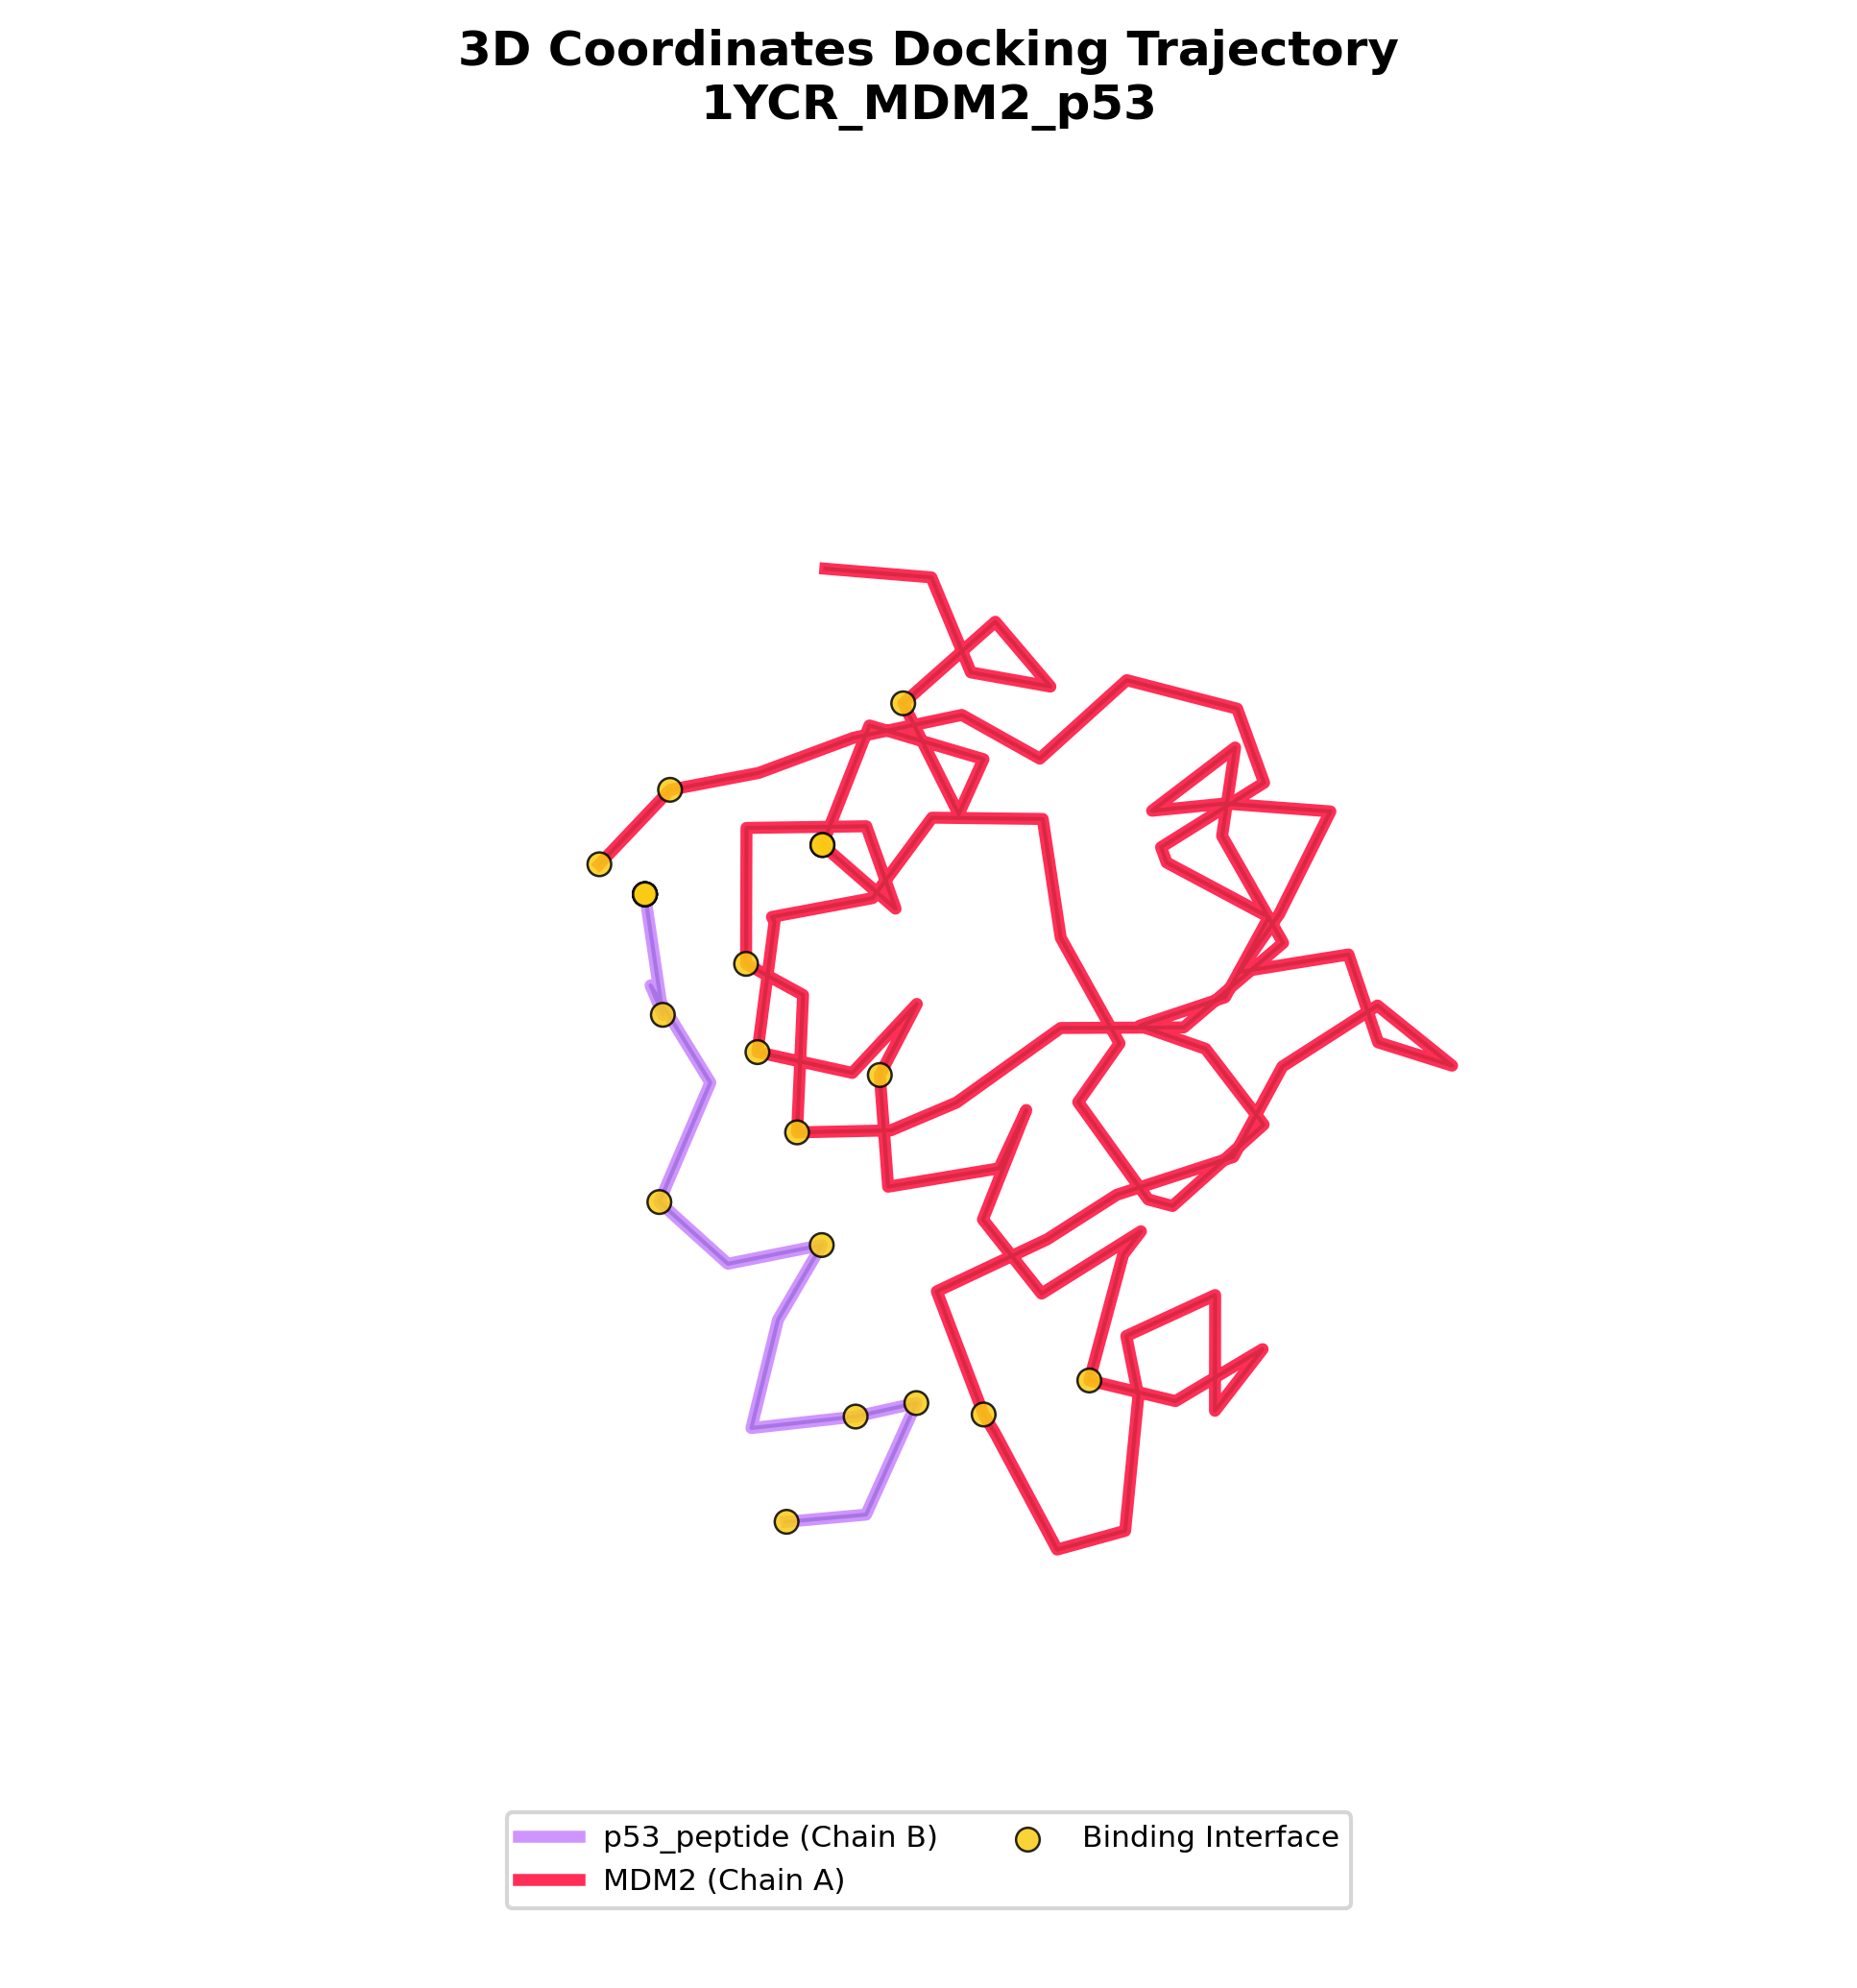
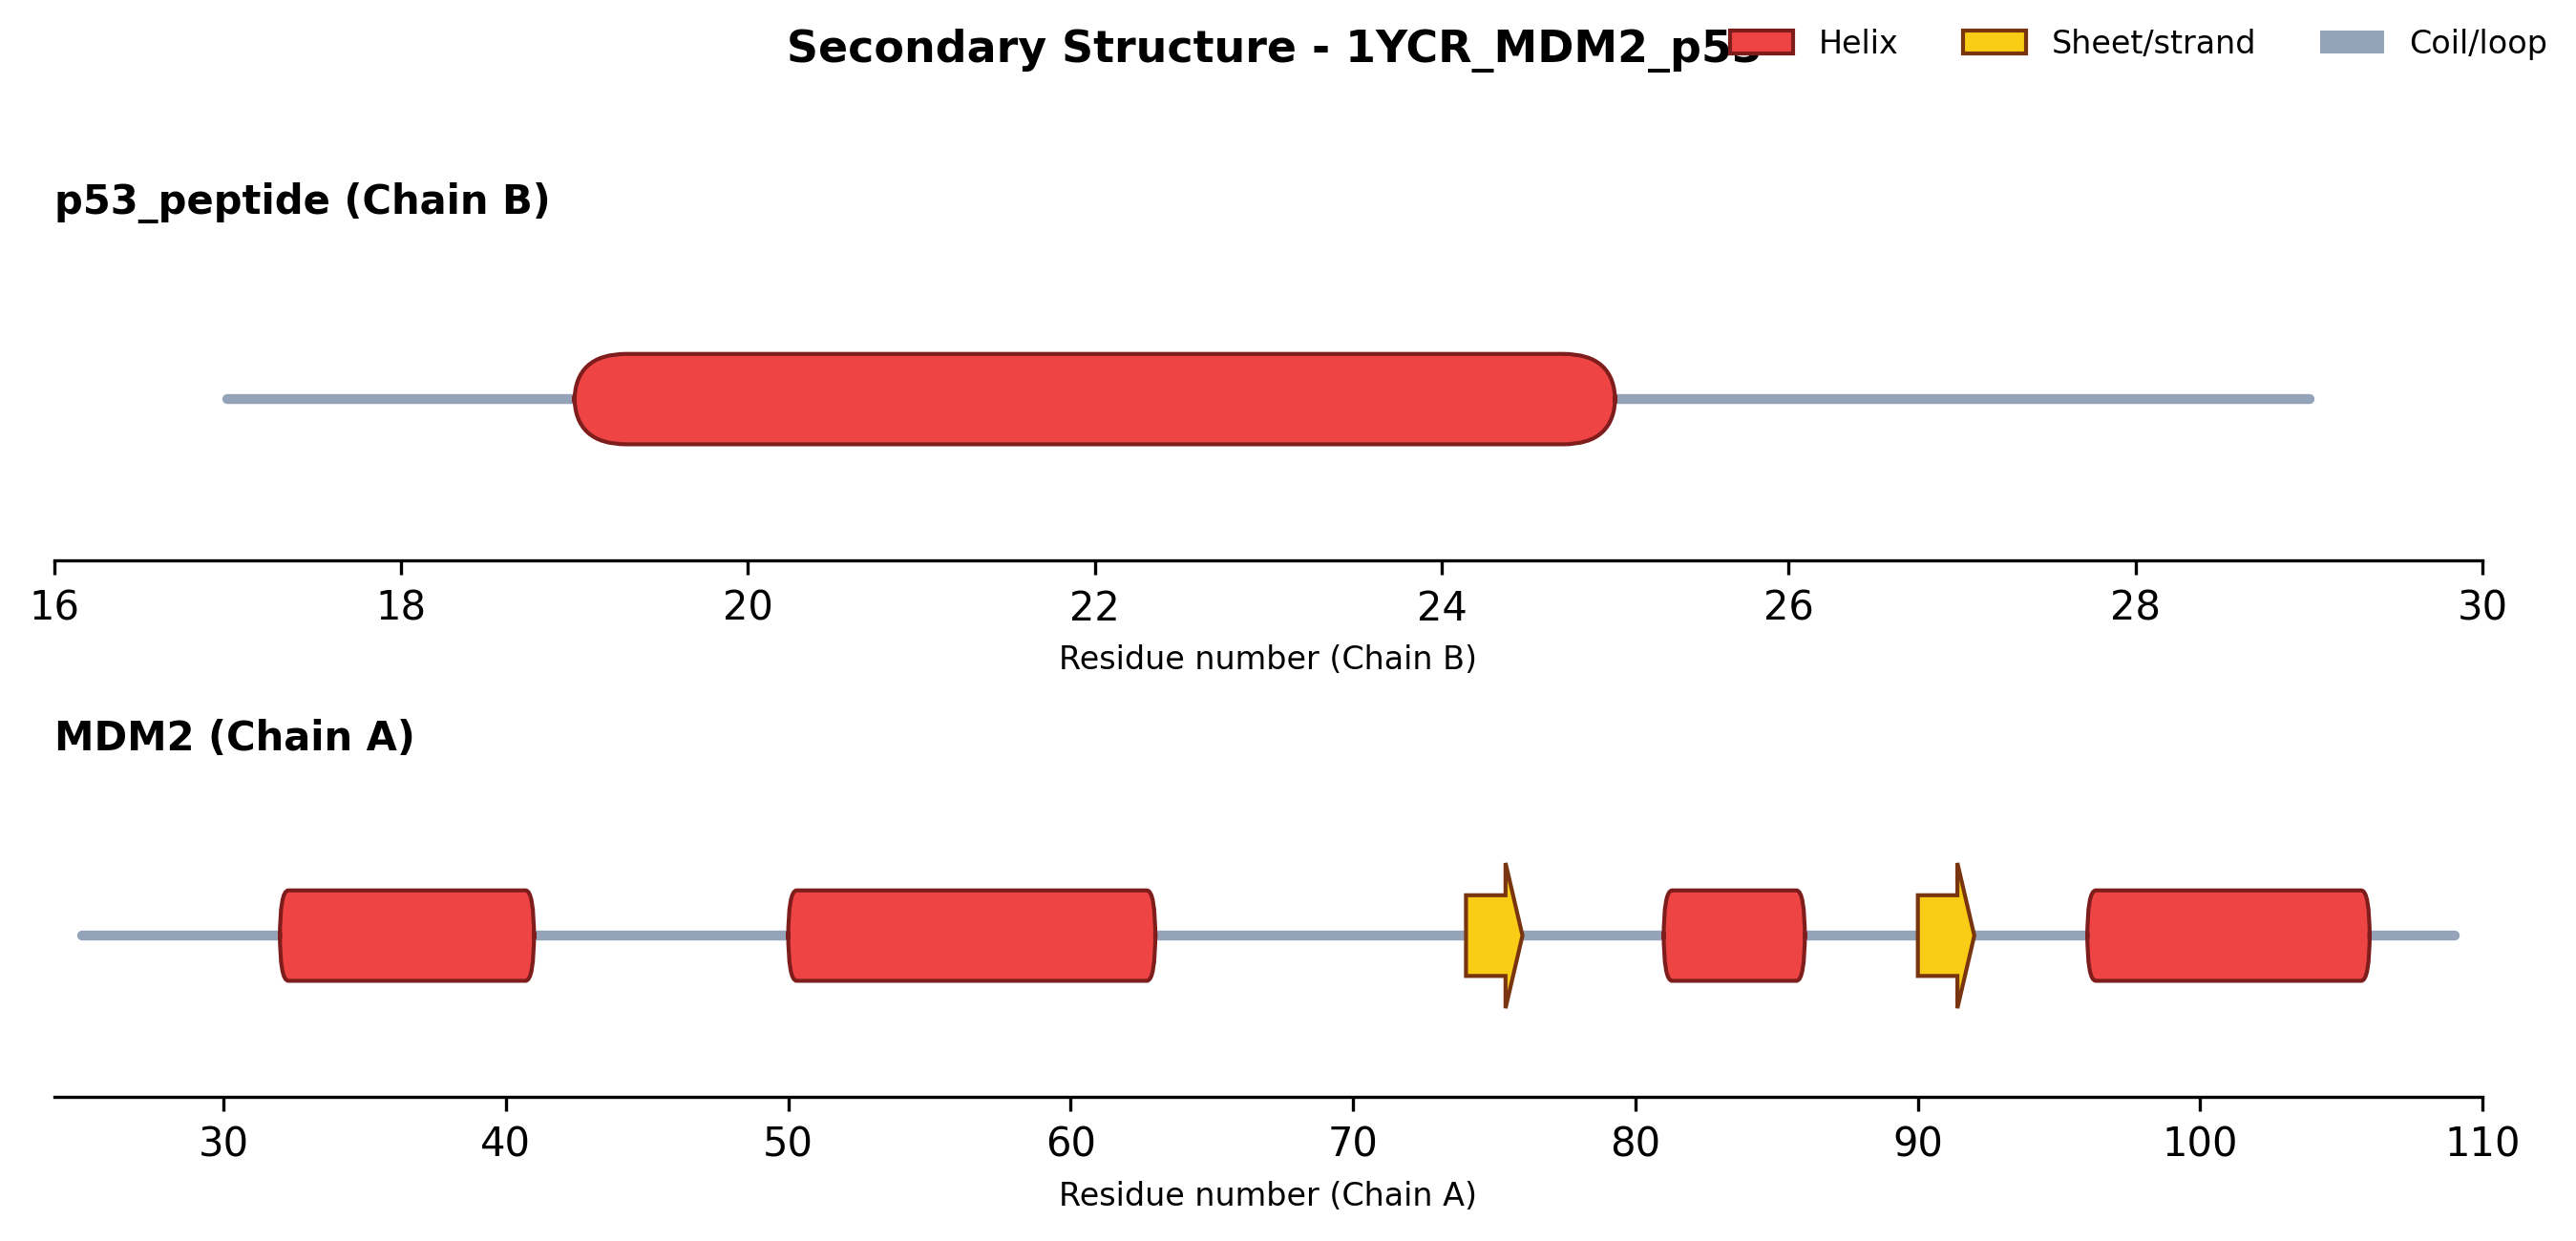
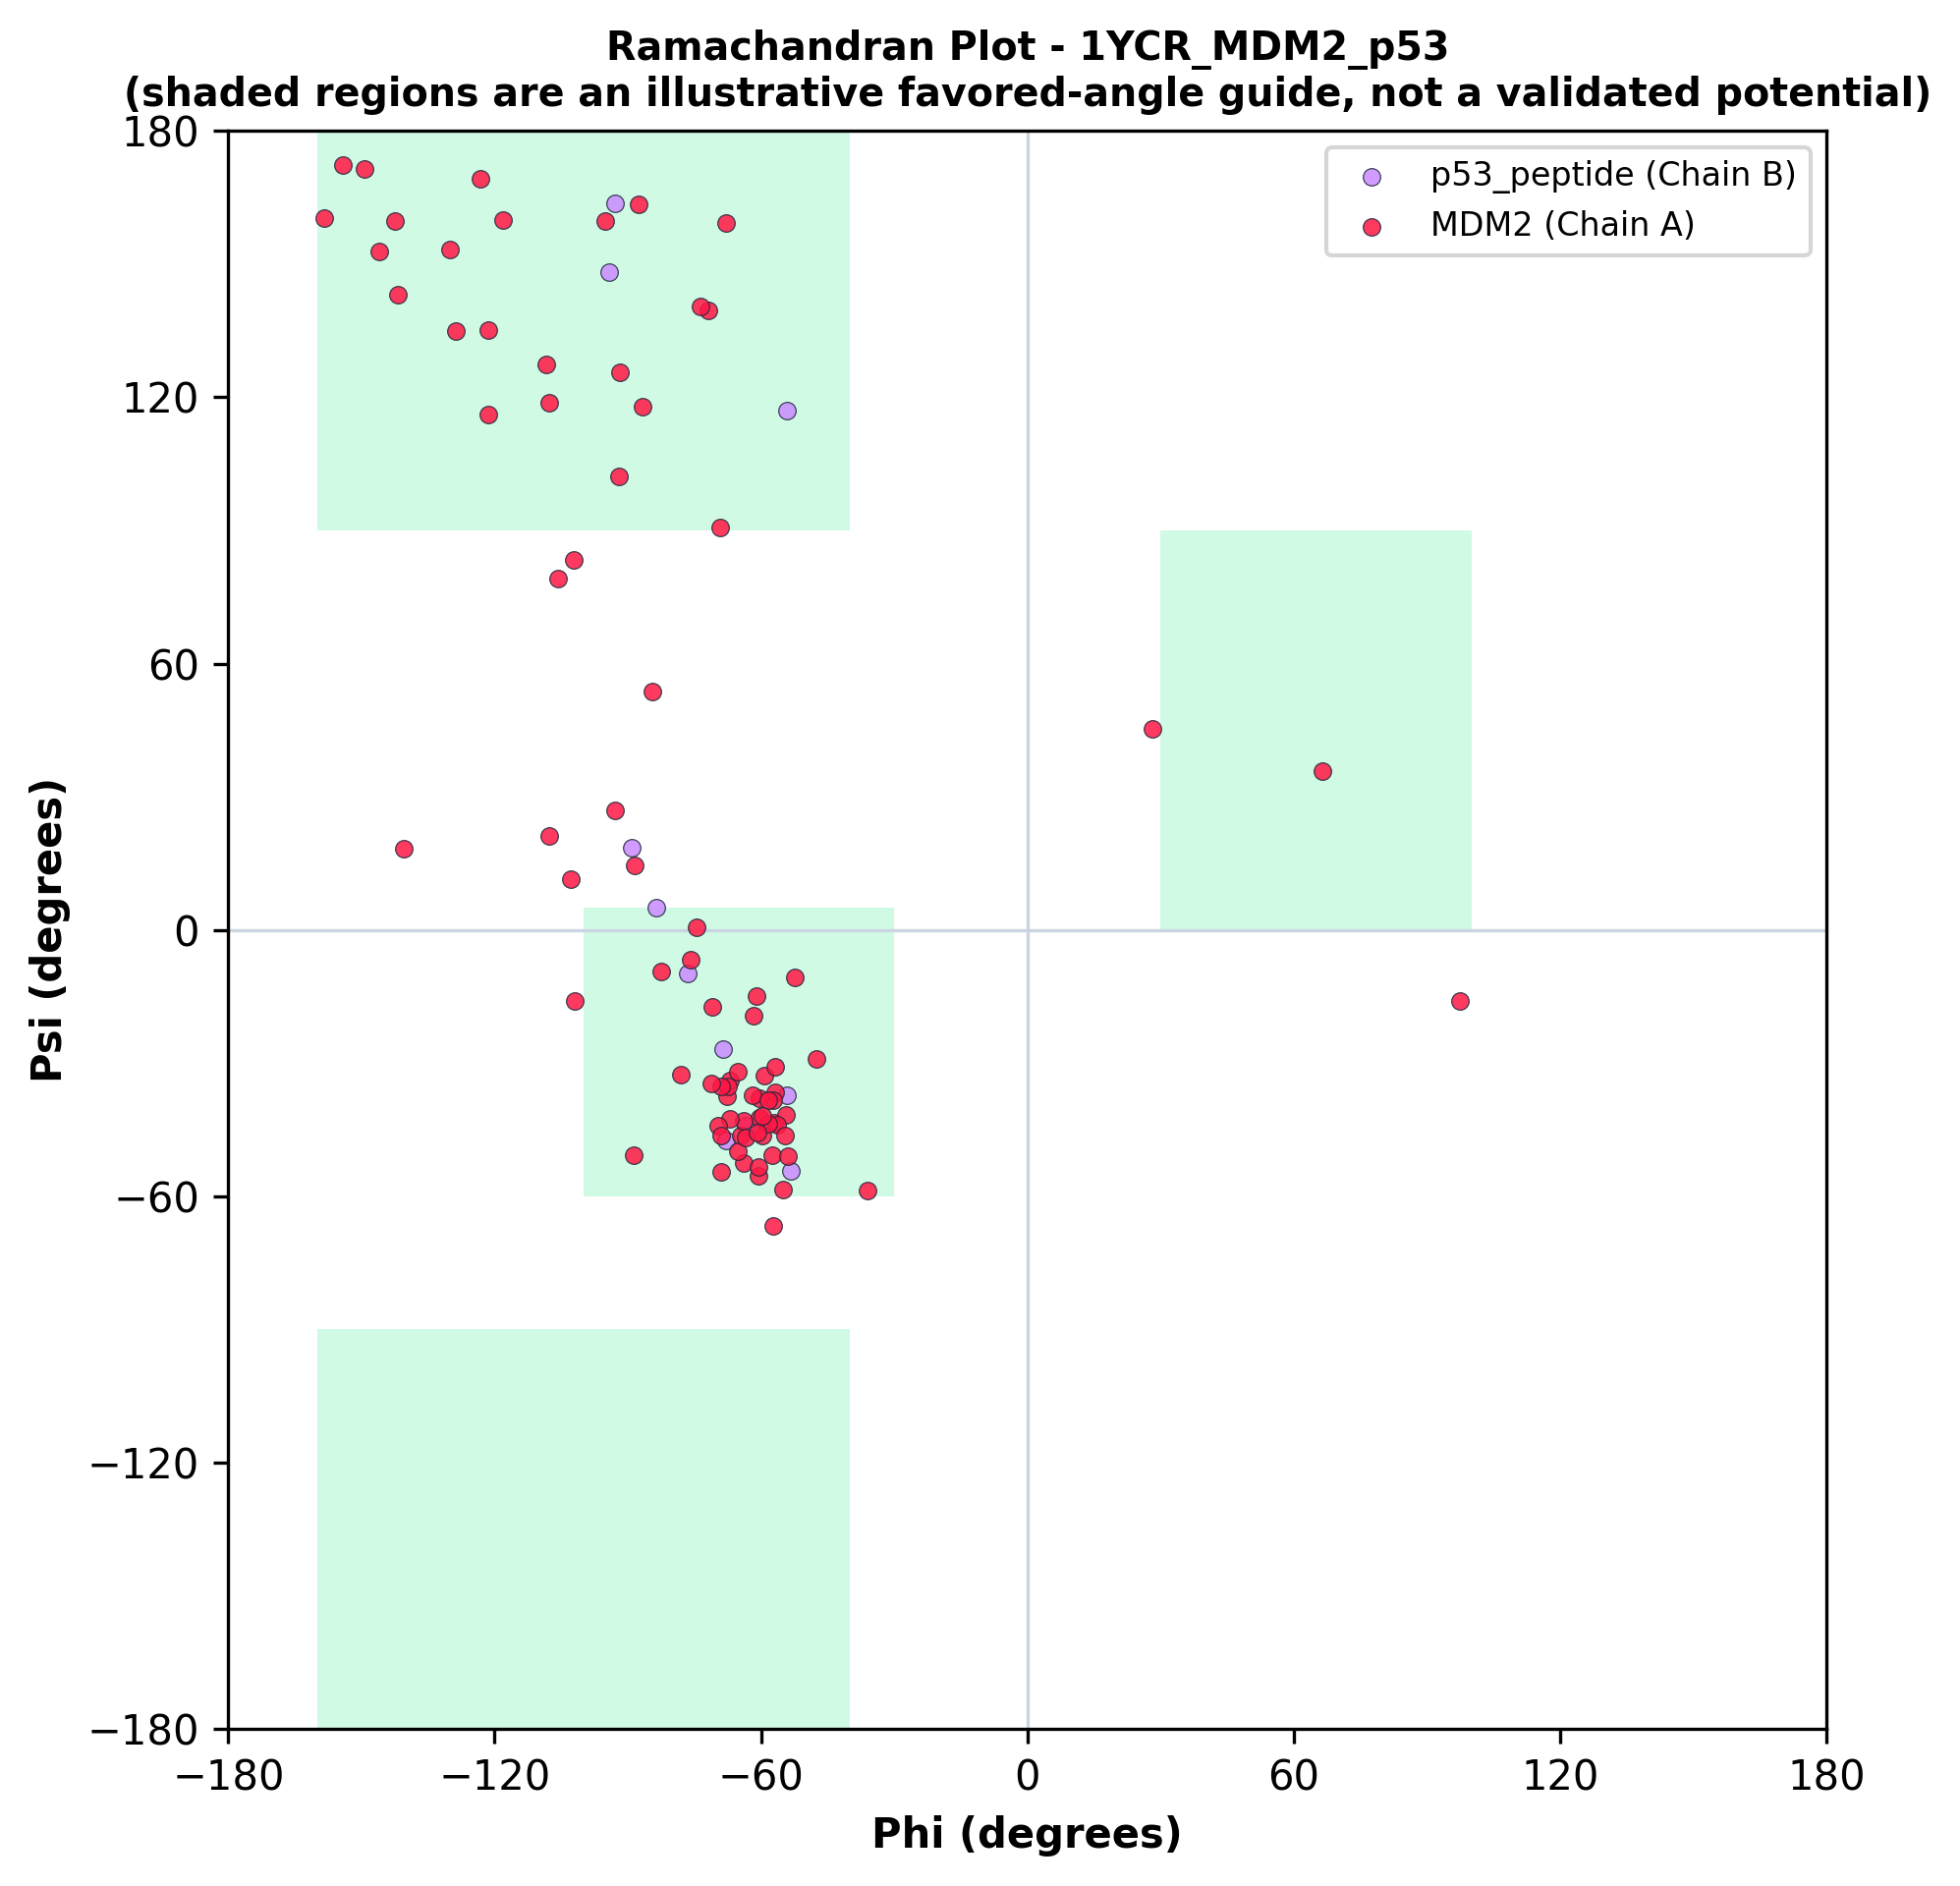
Generated by running the interface analyzer on PDB entry 1YCR — MDM2's binding domain (chain A) with a 15-residue p53 peptide (chain B) docked into it.
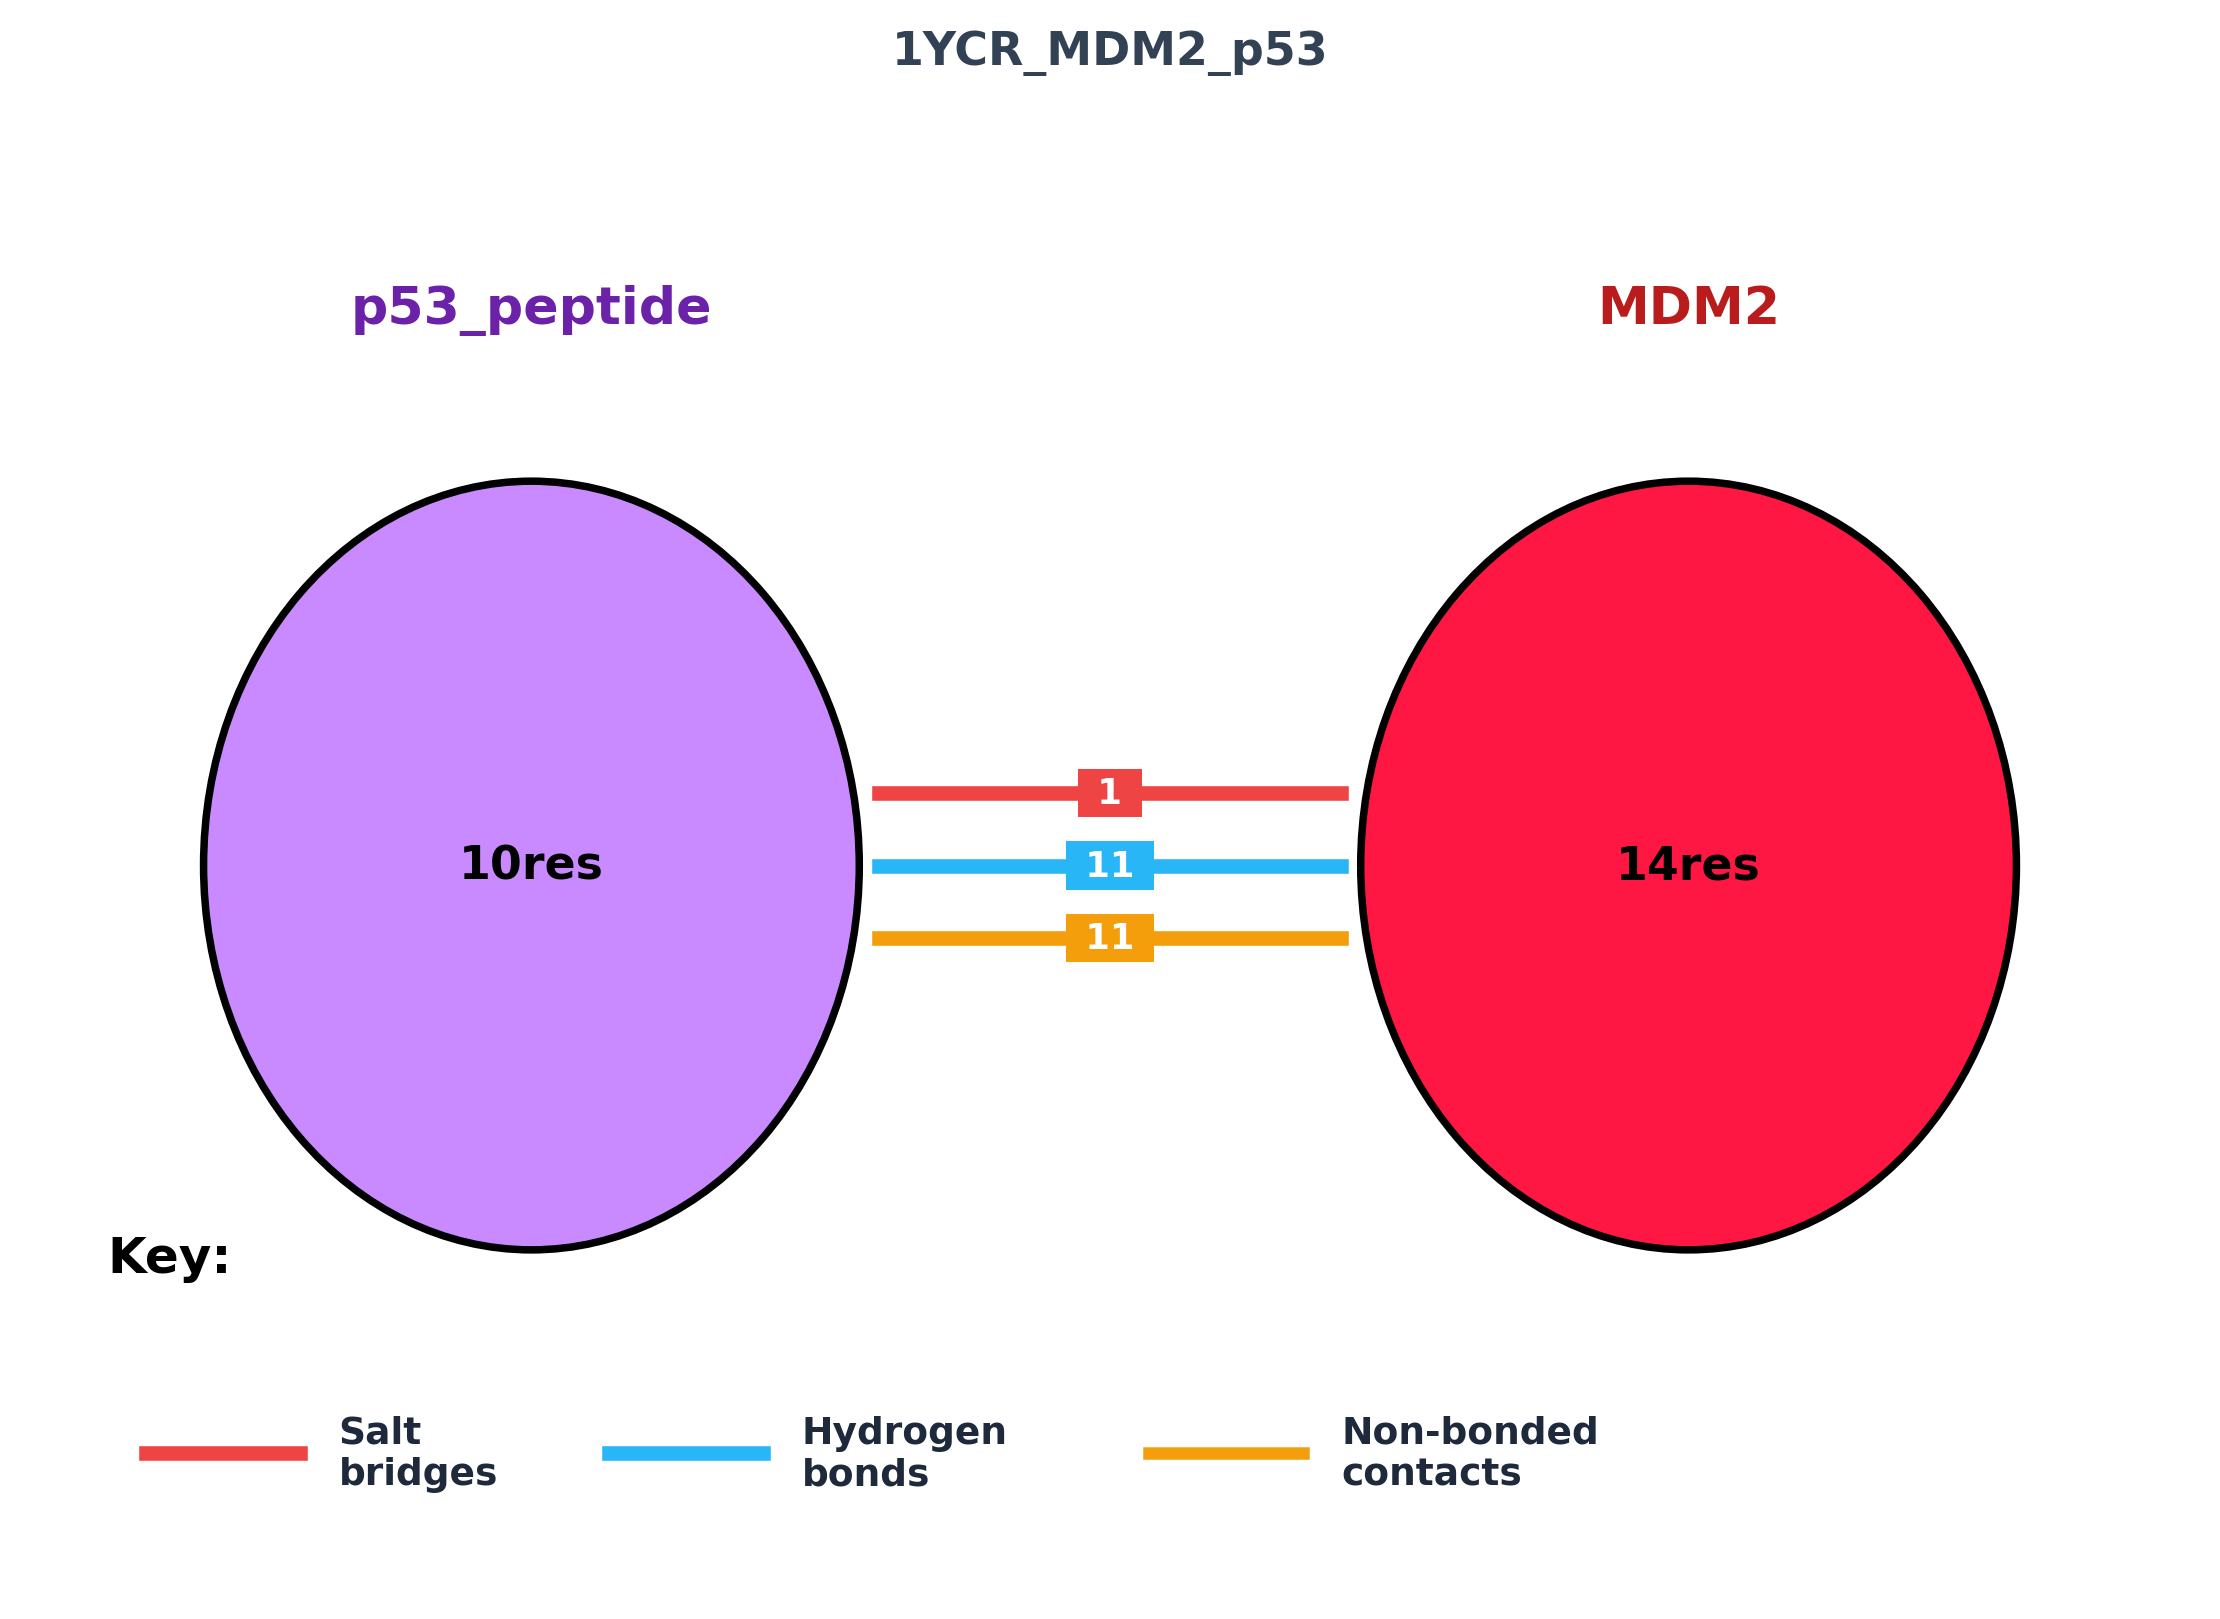
Includes full text reports and interactive docked_complex_3d.html 3D viewers — see examples/ for complete sample outputs.
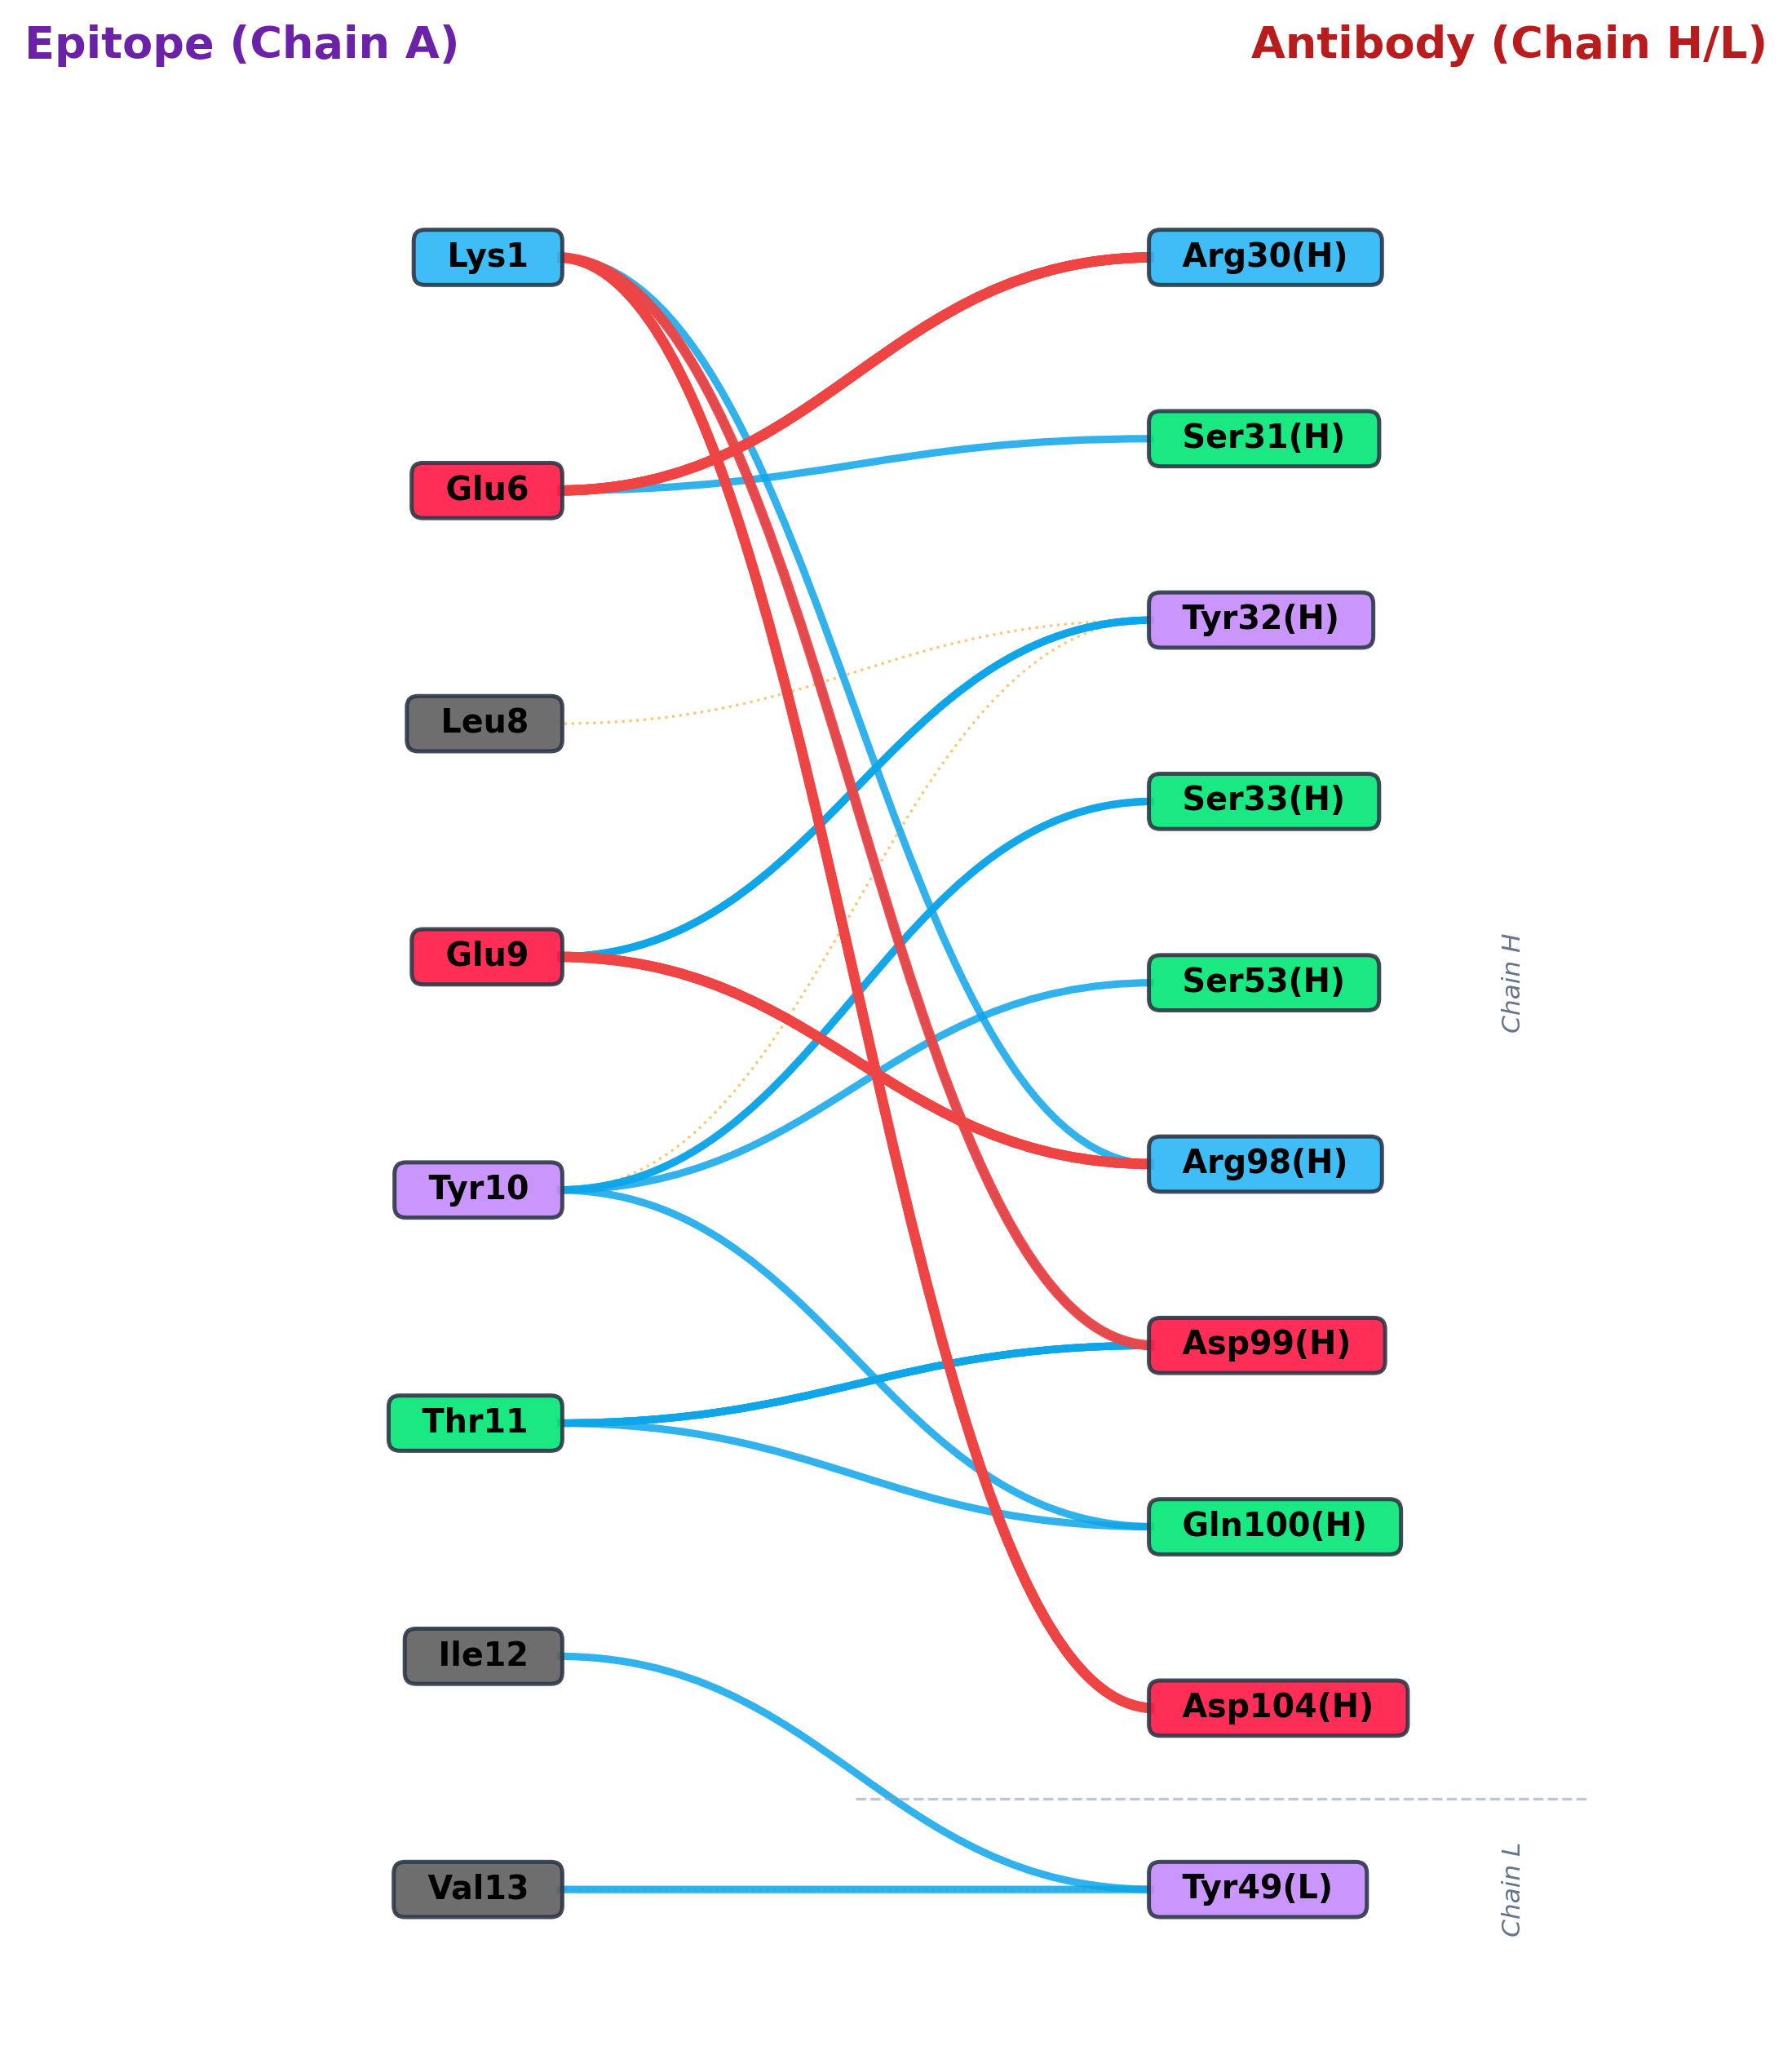
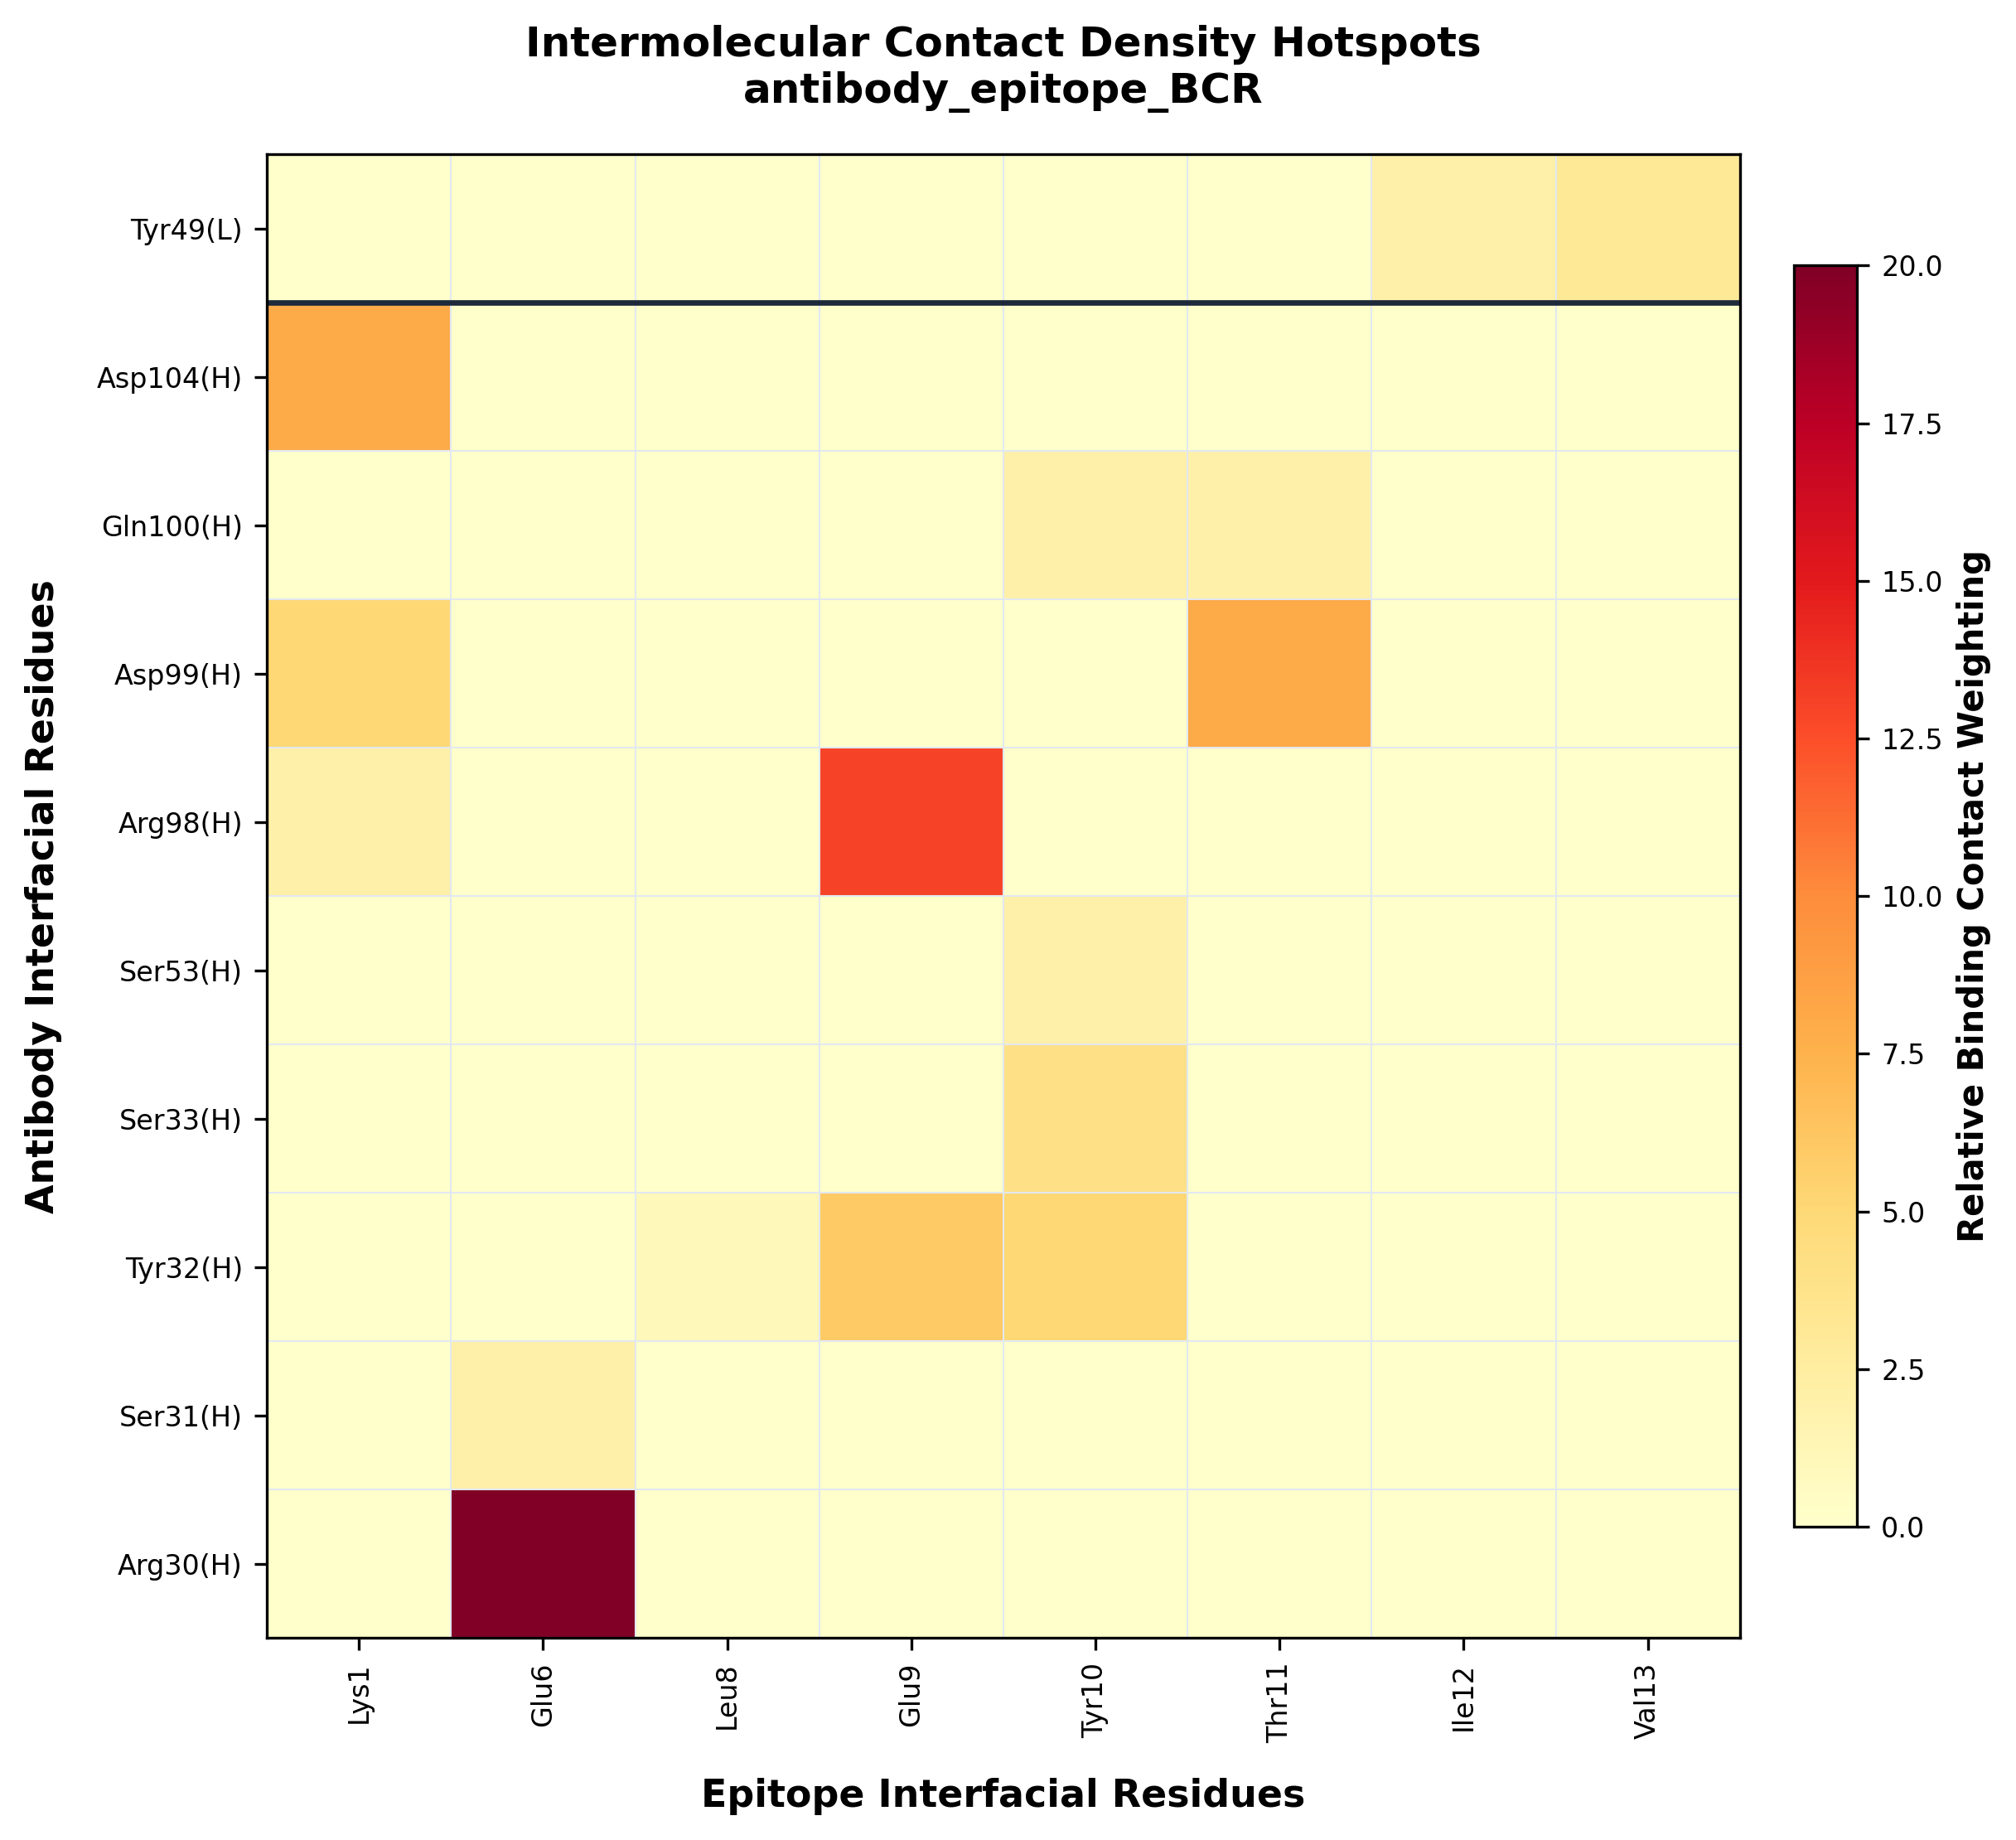
One side of an interface can consist of multiple chains — such as an antibody's Heavy (H) and Light (L)
chains binding an antigen epitope (A). Pass --receptor-chain H,L and every plot disambiguates residues
by chain automatically.
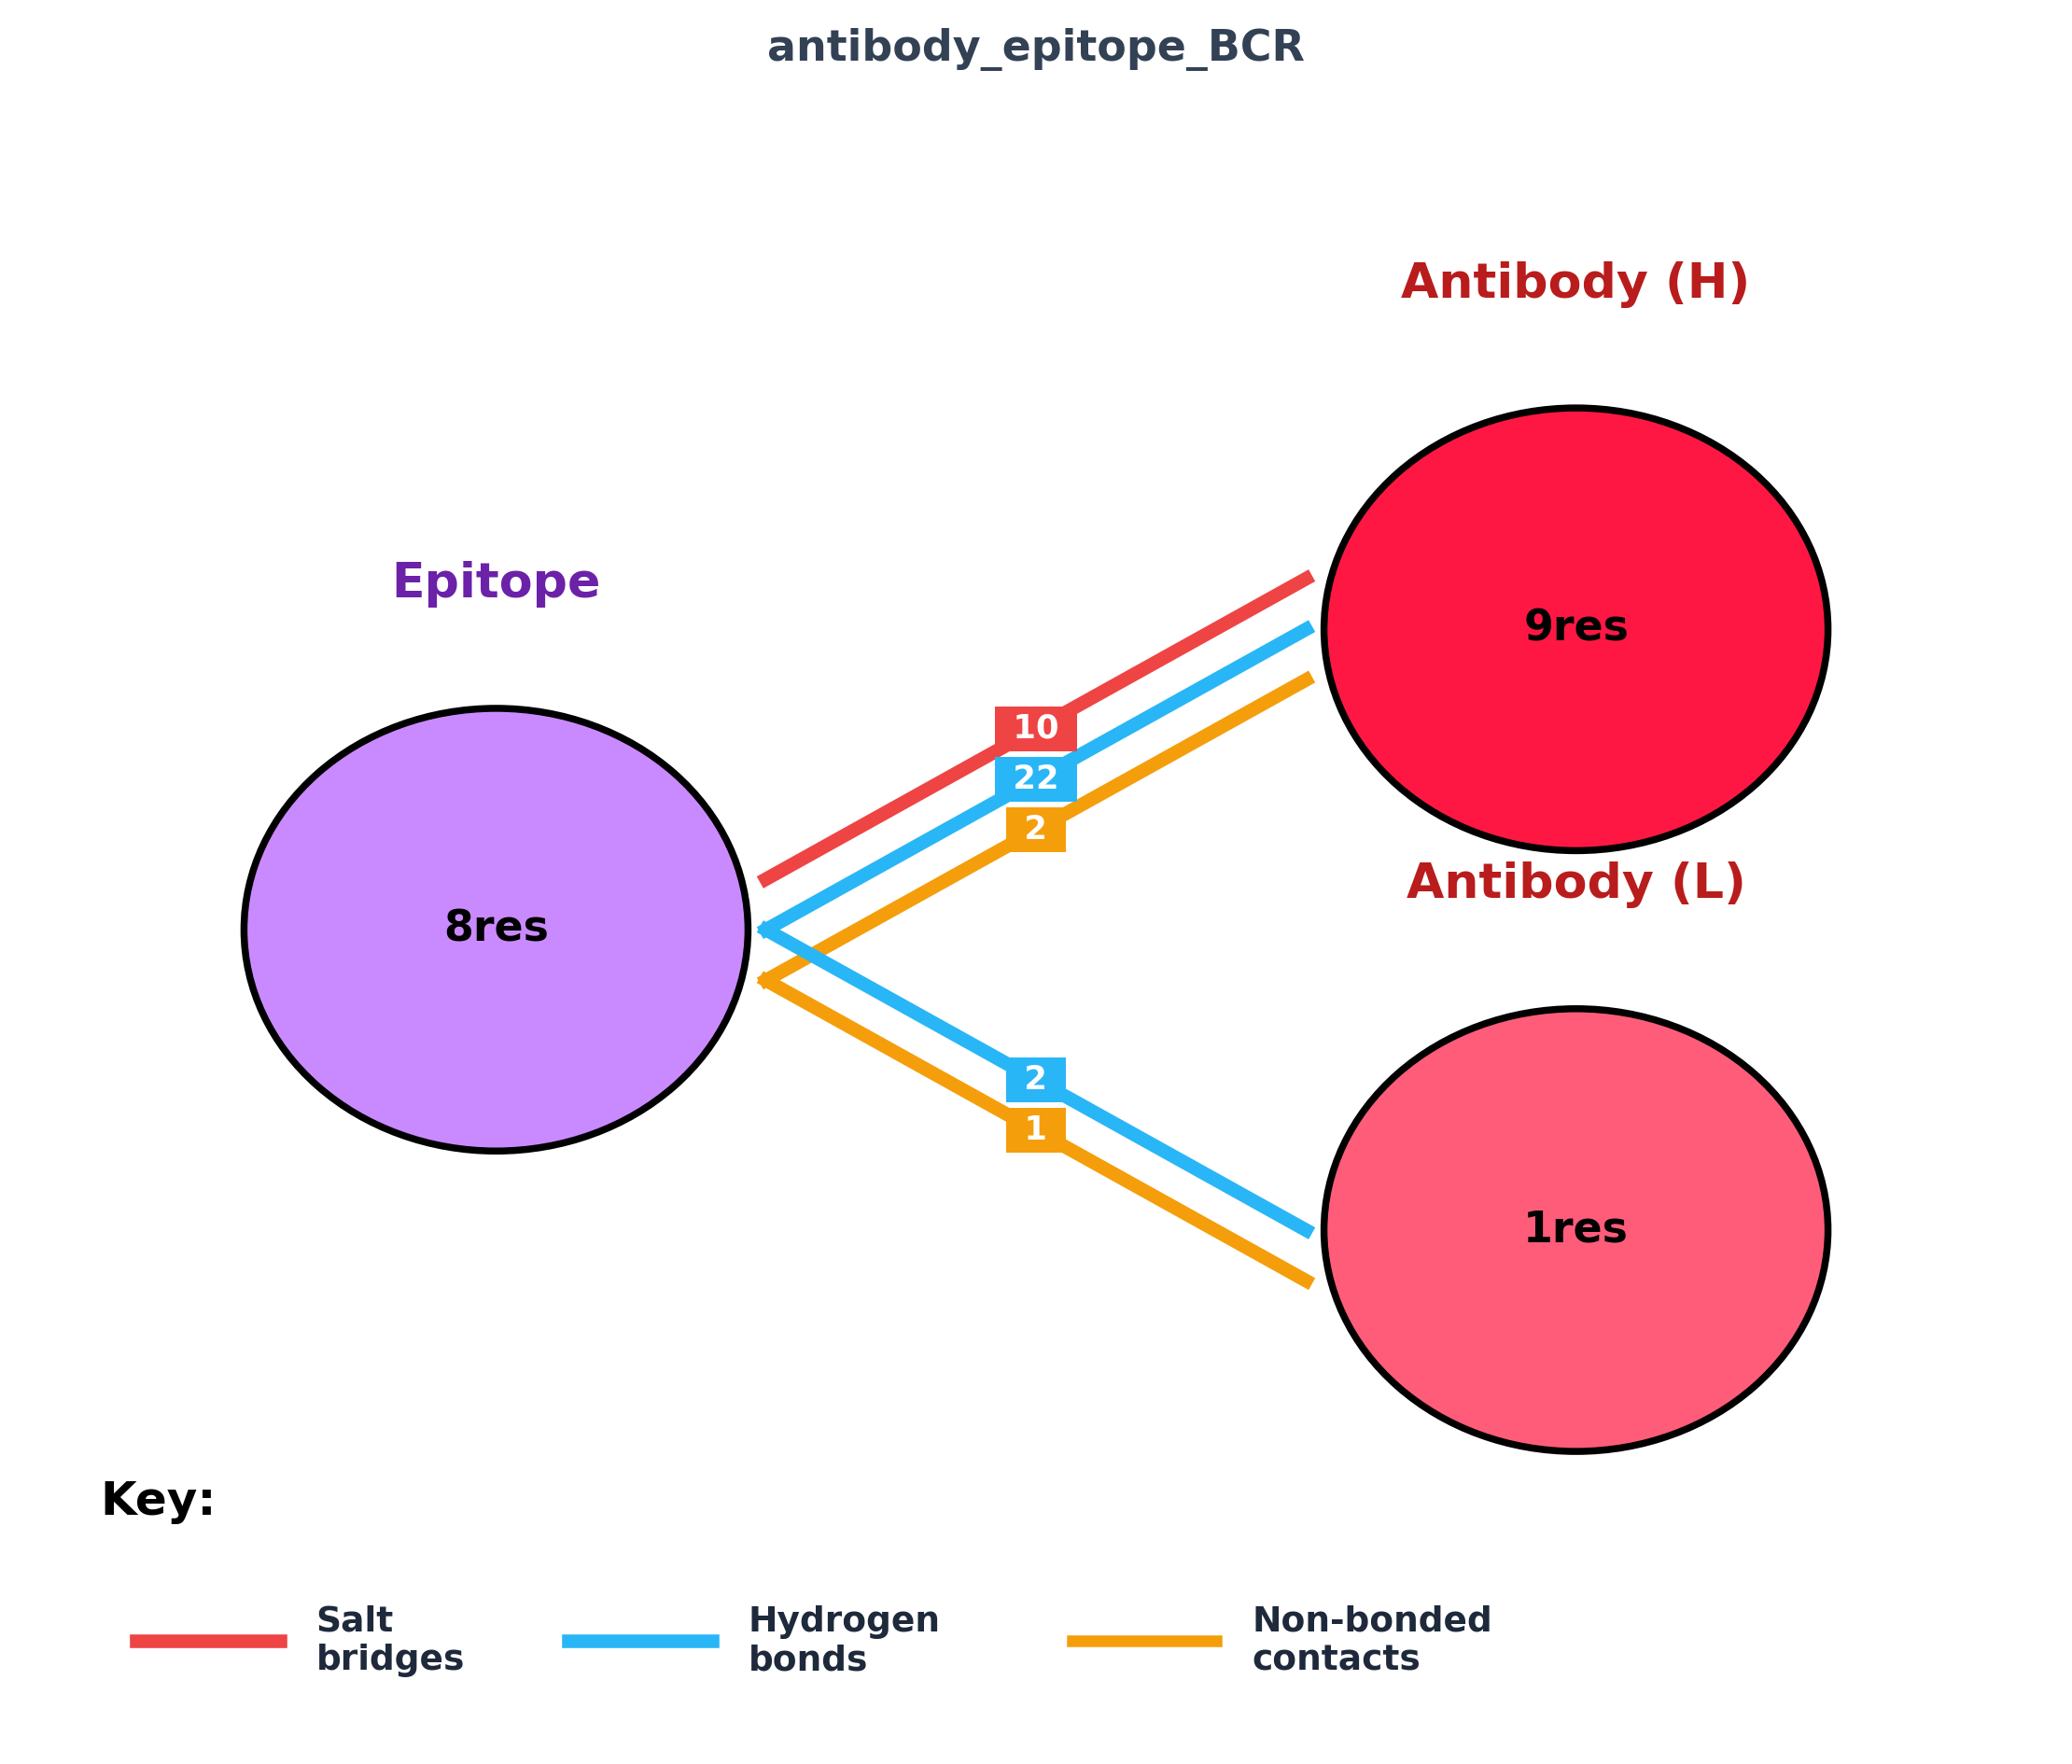
Download the project, install two requirements (numpy, matplotlib), then answer simple prompts.
python src/easy_start.py
Read the full walkthrough →
Fetch a structure by PDB ID or upload your own, run everything in the browser, and download a zip of results.
Open notebooks/PDBsum_Interface_Analyzer_Colab.ipynb
Launch in Colab →
Full control over multi-chain analysis, custom labels, and distance thresholds.
python src/pdb_interface_analyzer.py complex.pdb \
--ligand-chain A --receptor-chain H,L
See all interface options →
Analyze individual protein chains for secondary structure, composition, and Ramachandran regions.
python src/pdbsum_single_chain_analyzer.py protein.pdb \
--chain A
See single-chain options →